Analyzing your data in Google Analytics shouldn’t be a daunting job for marketers and website owners. Dashboards are exactly what you need to easily review, important data and show either your boss or your customers automatically generated reports that are not just full of useful numbers, but as usual for Google Analytics very visual.
If you need a more academic definition I would recommend reading an article by Stephen Few called Dashboard Confusion Revisited where he kindly gives us this clarification:
“A dashboard is a visual display of the most important information needed to achieve one or more objectives; consolidated and arranged on a single screen so the information can be monitored at a glance.”
Before going any further let me ask you to refresh your Dimensions and Metrics knowledge here: https://support.google.com/analytics/answer/1033861. Will quote Google Analytics for a quick reminder: “A dimension is a descriptive attribute or characteristic of an object that can be given different values. For example, a geographic location could have dimensions called Latitude” and “Metrics are individual elements of a dimension which can be measured as a sum or a ratio. For example, the dimension City can be associated with a metrics like Population”. Surely you can find a lot of pre-built reports out there, but being able to modify them and adjust them to your business needs is becoming more and more important. A bit of customization always help in order to make matters simple…for you, for your boss or your business.
Before talking about one of the most important dashboards – The Social Media Dashboard – lets make sure we know how to Build a New dashboards from scratch. As with all Google products building one is extremely easy (not if you are not familiar with Dimensions and Metrics). Just go to your property and click on “Dashboards” which happens to be the first thing you see on your left hand side menu.
Did I say first?
Google knows that people may get lost when browsing through all the tabs, views and reports that Analytics provides, so Google is providing us with an easy way to get an overview of our accounts and their specific performance. Back to the Dashboard menu once you click on it you are presented with two options: a dashboard called “My Dashboard” or an option to create a new one. When creating your first dashboard in my opinion it will be easier if you start by just modifying the starter dashboard template. When confident enough be creative and start adding your own widgets in the Blank Canvas.
To learn more just visit Google Help here: https://support.google.com/analytics/answer/1068218?hl=en-GB , or as usual contact me at [email protected] and I would be more than happy to get you started.
Now that we know everything about Google Analytics Dashboards we are ready to talk about a dashboard I have been recommending for a very long time called Social Media Dashboard. Social media is becoming an essential marketing channel for businesses. The brand awareness created by social media and measured by many in “likes”, “+1s” or “tweets” is precious but I am afraid not enough. To demonstrate the real value of social media to your business you have to measure the Return On Investment (ROI) social media brings to your business. No way you gonna convince you “sponsor” to invest money and human power into social media without connecting it to the broader financial goals of your business.
Everybody who uses social media to promote his website and drive traffic should be aware of the power of this simple and effective way of showing how social media activity is converting for your business called Social Media Dashboard.
To summarize the features of this dashboard: it contains 12 widgets and it will show you how much online and offline intercommunication your website gets from social media. It includes things like where your social traffic comes from, customers social loyalty, social media value to name the few. To show you the full picture I will briefly go through each widget and try to explain the main features.
Visits from social networks. The name is probably self explanatory as this widget basically shows visits from websites Google identifies as being social media sites. A quick overall of how your social media efforts are paying off.
Goal Value by Social Network. This widget shows the percentage of the total goal value each social media platform brings to your business. Why are those numbers so important. Because they give answers to some very important questions. Is there a point of spending money and human labour in a given social media platform if it doesn’t monetise. Which social media platform brings most of the money. Which one is the weakest and needs rethinking.
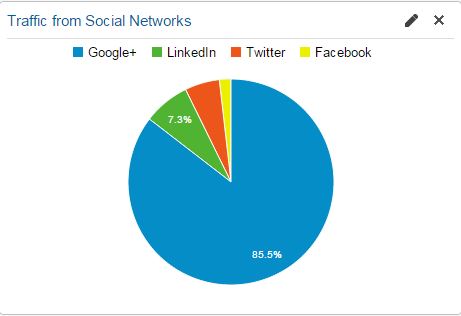
Traffic from social Networks. Widget showing very clearly (visually) which social sources are driving the most traffic to your website. If it’s traffic that you are after this is the perfect widget to look at. In my experience though results from this widget have to be always compared to results from previous widget – Goal Value. Traffic is not always enough to determine the effectiveness of a social media platform.
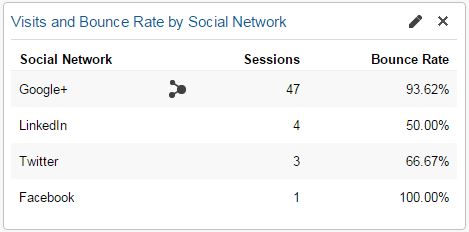
Visits and Bounce Rate by Social Network. Driving traffic is one thing, but making people stay is a completely different game. This widget shows the stickiness of your page content and it’s somehow complementary to the widget above.
Data Hub Activities by Social Network. This widget basically shows how people engage and re-share your content on social networks. The information comes from the Social Data Hub.
Trackbacks is a term used by Google to describe links on other peoples website linking to your content. Quite useful if you want to build relationships with people/blogs regularly linking to your
To learn more about the free social data hub by Google please visit this link: https://developers.google.com/analytics/devguides/socialdata/socialOverview.
Data Hub Activities by Social Network – Visual. Some likes numbers some like graphics. This widget basically replicates the data from the widget above, but in a more visual way.
Data Hub Activities and Site Visits by URL. Knowing which page is shared the most is a valuable asset for every marketer. If you happen to be targeting specific pages in ad campaigns, you can see how well your ads are doing for those pages.
On Page Social Actions. This widget shows interactions with buttons like +1, Like or Twitter on your pages. Clear indication of whether visitors like your content and want to share it with others. Although highly debatable I do believe that social signals have an impact on organic search rankings. Whatever you SEO master is telling you, Google and Bing do take data from social platforms in order to rank your pages. Apart of that people do spend more time on social networks than search engines and one thing became clear from the early days: people are more likely to trust a friend than a search engine. So if people share your stuff, trust me their friends will visit your website.
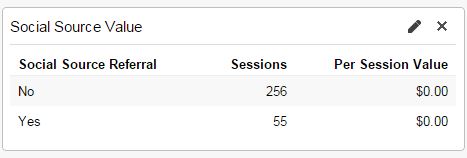
Social Source Value. The perfect and the quickest way to compare the economic impact of different types of sources of traffic. How does social media compare and compete with other sources bringing visitors to your website. Be careful here as your boss may scrutinize you for the numbers shown. On the other side if the numbers are “good” don’t be shy and point to this widget straight away.
Revenue by Social Network. Your natural direction after the widget above should be the value each social media platform is bringing to the business. A lot of people will look at those numbers and will realise that their money and effort and not going into the right platform. Finding the right social media network is the key to success.
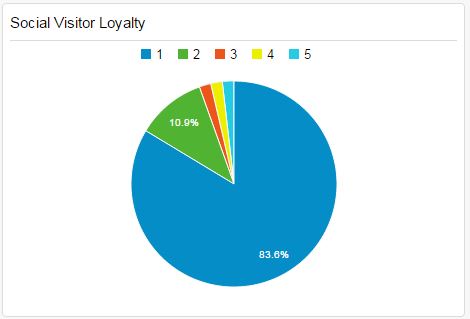
Social visitors loyalty. How loyal are your visitors from social platforms? The pie chart you see in this widget will give you a clear picture of the “stickiness” of your articles.
Let me quote here David Amerland: “Brand loyalty is earned rather than bought and what earns it is engagement.”
A study by The social Habit shows that 53% of Americans (we see the same all over the world) who follow brand in social are more loyal to those brands. What does that mean to businesses. By taking time to build loyalty to your brand on social media platforms, you can significantly increase the ROI of each of your customers by giving them more reasons to come back to your brand and convert in the future.
Social visits from Mobile. By all means last but not least. According to David Amerland “More than half of the online traffic these days comes from mobile devices. A website that is not mobile-friendly is not only missing out of a large slice of visitors but it is also setting itself up to receive a black mark in ranking in search. “
To add to that a recent study by Social Media Examiner shows that “users are spending more time accessing social media from mobile devices compared to desktop computers.
How much more? Pinterest users are 92% mobile; Twitter users are 86% mobile; Facebook is 68% mobile; and Tumblr is 46% mobile.”
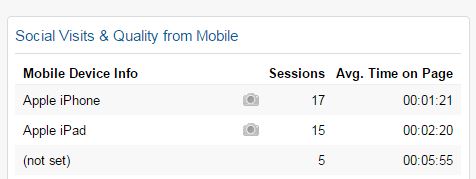
Have a good look at the numbers in this widget. Do you see a lot of visits from iPhone or Nexus 7. Is your website optimised for those mobile devices? Are there a lot of visits from Samsung Galaxy but short Average Time on Page? Spend some time carefully examining this widget results as customers are visiting your website more and more using their mobile devices.
In Conclusion…
When developing your (or your customers) social media marketing strategy you have to be able to demonstrate return of investments. You can be very active and create and share a lot of content by using your chosen media platform, but if you do not monitor your social media activities you can not control and measure their impact on potential clients. On the other side if you can’t control the social media impact you are creating then you most probably cannot control your online reputation as well. In a way you are left out of the conversation,but you want to be right there in the middle of it. In the end of the day more followers, more loyalty, more trustfulness means more awareness of what you’ve got to offer. No need to tell you that the latter ultimately means more financial benefits to your business.
Let me finish this article with a citation from a blog I’ve visited recently that explains everything I’ve said above in one simple sentence: “Thing-finding is connecting the dots in a new way and thus building unexpected bridges of understanding.”
Download the Social Media Template here: https://www.google.com/analytics/web/template?uid=QHSKYyplTzuXnAVfJ53NJA

Leave a Reply