You Have Struck Gold By Using Google Analytics – Now Start Working Smarter!
One thing I find fascinating is a lot of people tend to overlook Secondary Dimensions in Google Analytics. This is rather unfortunate as Secondary Dimensions could be extremely valuable when trying to understand what the reports actually mean.The best way to do that is to put data in context – hence the beauty of Secondary Dimensions allowing us to compare a set of metrics in one dimension to a set of metrics in another dimension.
Let me be clear from the start. Secondary Dimensions don’t need setting up. They are already there for you to use in every Prime report – no magic needed just experimenting (!). In this vast amount of information in Google Analytics every report can be customised to your business needs.
People always understand example more than anything else so lets give some.
We all know which channels are driving the most visitors to our websites, but which channels are driving the most page views to specific pages? Just go to Behavior and “All pages” report and select “Medium” as your Secondary Dimension. Boom (!) suddenly you see all the channels and page views in relation to your pages. You also see the different reaction they are having to your content. The wisdom here: use those differences to optimise and improve your landing pages. Go on have a quick look at this report and tell me what you see….
Now something a bit more complicated. Every paid search professional is running ad tests (at least I hope they do) with the most common being different ad headlines. Go to Acquisition and “AdWords Keywords” report selecting AdWords Keywords as you Second Dimension. Boom (!) now you see which headline/keywords are the most successful in your PPC account which will allow you to channel more impressions to those. Did I say “a bit more complicated”, but you see it as super easy. Yes, because it is very easy and clever.
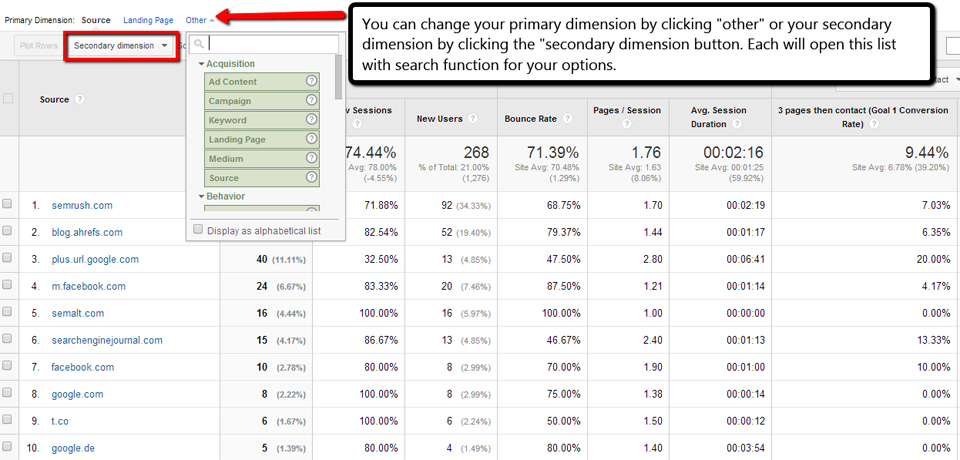
When introducing Secondary Reports ,Google made sure they are very quick and intuitive. To use them all you have to do is click the “Secondary Dimension” drop down tab above the table of data, and input a dimension you want to compare the default dimension to. How do you back to your default view? Just click the(X) located by the Title of the Secondary Dimension and you will be back to default view of primary dimension. Quick and intuitive.
My top 3 dimensions for standard google analytics reports:
1. Content->Events->Top Events-> Event Category(primary dimension) + Event Action (secondary dimension): In my opinion the easiest way to see what specific events are working best, by showing both the category and event action. Most beneficial if you have a lot of event tracking or if you track outgoing links.
2. Traffic Sources->Search->Organic->Keyword(primary dimension) + Landing Page (secondary dimension): A good way to show top content/landing pages in terms of top organic keyword searches including (not provided) keywords.
3. And last but not least:Audience->Behavior->New vs Returning->Visitor Type (primary dimension) + City (secondary dimension): This shows top cities visitors are coming from in terms of new and returning visitor traffic, also shows the difference between various cities. Can explain potentially what new cities should be target markets. Very useful for companies (like the one I am currently working for) doing business all over the globe.
I hope that with this basic tutorial I have convinced you to have a good look into Second Dimensions. As they don’t need any setting up and are easily accessible I encourage you to start playing with them to get deeper levels of insight of the Google Analytics Data.