
Many people confuse data with insights.
What is the difference?
What Is Data?
Data is the information you acquire from users, such as demographic info, behavior, and activity.
What is Analytics?
Analytics is the discovery of patterns and trends obtained from your data.
What are Insights?
The ability to gain an accurate and deep understanding of someone or something through the use of analytics. In other words the deeper understanding of something or someone through analysing data.
As digital marketers, we are the bridge between the data and the people who have to make a decision based on the insights coming from this data. Our job is to take the data and transform it into a meaningful story that a business can truly understand in order to translate data into actionable insights.
The insights gained through analytics are incredibly powerful, and can be used to grow your business while identifying areas of opportunity.
Common mistakes
The noise is confusing the signals.
We are hardwired to see patterns even if they are not there. Make sure when analysing your data that you are not getting information based on ‘your needs’ so you see signals where’s there is just noise.
Don’t measure meaningless metrics.
Make sure that you only measure and draw conclusions from stuff that matters for your business.
Is ‘email open rate’ giving you useful insights? The way I see it if someone opens an email it does not mean that they read it. You don’t even know for sure that they took interest in your content.
Don’t you think that ‘Click-through rates’ actually tells you how effective your email content is and what content you should send next?
Confusing correlation with causation.
The best way to explain this one is by giving an example. People buy more clothes when the weather is cold not because they need more clothes to keep them warm but because Christmas is in December (Winter). So assuming that people buy more when the weather is cold (this may as well be the case for some particular businesses) is simply wrong. I may even argue that most people buy their ‘warm clothes’ during the summer months when they are heavily discounted.
Which leads me to the next point.
Not accounting for seasonal variations.
It is quite obvious to me now that customers behave differently according to the season and according to seasonal habits. There is always an increase of browse and spend during the Christmas period so the month over month growth figures in January are not the most accurate ones.
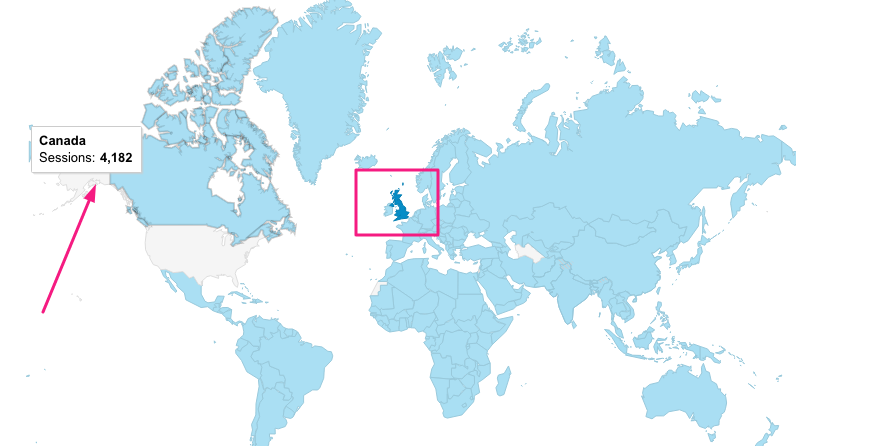
Ignoring Geography.
The all too often forgotten element. It doesn’t make sense to include international data in your analyses if you only sell locally. On the other side if you do sell internationally than it makes sense to separate your high priority markets from less important ones. A good example for disregarding Geography would be counting visits from Canada if you only sell in the UK.
Data can replace intuition (and vice versa).
Recently I was doing an SEO project for a company involved in baby products distribution. So the first thing I said to the CEO of this company was “I’d like to start with a little research so I can establish who your customers are”.
He said, “I know who my customers are. They’re moms, females between 20 and 40 years old.” I said, “Wow, how do you know?” He looked at me like I was crazy. He said, “They’re my customers. I’ve been doing this for years. Don’t tell me you still use baby oil on your body”
Now it was my time to look at him like he was crazy. “Yes, I do mate. Every time I shave my head. And I honestly don’t think I am a female and a mom.”
My intuition was telling me that I am not the only one using baby products.
In all honesty, he was not entirely wrong. A big chunk of his customer base was indeed moms in their 30s. But then he missed a big chunk of young ladies using baby oil for beauty purposes like makeup removal or conditioning and cleaning makeup brushes. And then a lot of men and women who use it like me as after-shave moisturiser.
The craziest thing that came from our research was motorcyclists using it to polish their bikes in the winter. Go figure.
Average Value.
And now something a bit more technical. Misusing average value is one of them. Averages are a great way to get a quick overview of how your business is doing. For example, if the average order value is increasing over time than your company is going in the right direction. True that! Which does not mean that all your departments are doing well.
Average order value by a department will allow you to identify ‘weak’ links in your business and also give you the opportunity to allocate your marketing efforts throughout your business more efficiently.
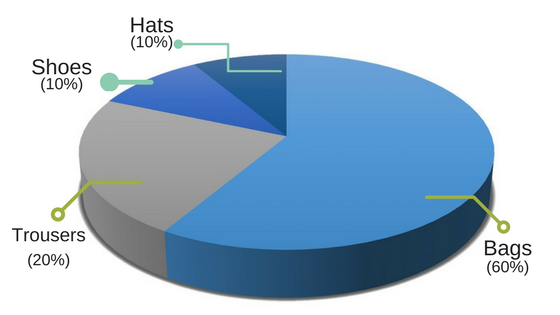
Tip: Don’t you ever do a Pie Chart of the average order amount by a department. Pie charts should always represent a slice of the whole. You cannot have a slice of the average!
Another misuse of average would be the not so famous anymore ‘average time on page’. Apparently, Google thinks it’s so important that it even displays it as a prime metric. Clearly, it is better if a visitor spends longer on a page because it means they’re engaging with your content. Hmm, not really.
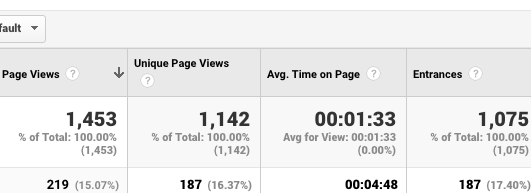
If I go to https://omisido.com/blog/, spent 5 seconds scrolling trough the articles, click on an article headline that I like and spend another 10 minutes reading the article and then close the tab. The average time on the blog page would be shown in my GA as 5 seconds. If I check the ‘average time on page’ shown for the article page it would be….hmm zero seconds.
Surprise, surprise. Google knows that when I was on the first page I clicked on a link so it can easily calculate the time between the entrance and the click.
Google cannot detect the tab closing so it records the ‘average time on page’ for the article as zero seconds.
Suddenly you realize that blindly applying statistics doesn’t explain what’s actually happening (and I know my example was a bit harsh but I hope you get the point).
Conclusion
In the vast ocean that is Digital Marketing, there is practically nothing you can’t measure. While this may seem like a big deal to you, it does have its drawbacks – the mere fact that you can measure everything doesn’t mean that you should. To really get the best of your data you should start looking past the raw numbers and begin seeing the big picture. The road to success is to have the ability to analyze on both the micro and macro scales.