What is Google Looker Studio (formerly Google Data Studio)?
- Google Looker Studio (Data Studio) is the Google Analytics 360 Suite’s data visualisation tool.
- Capable of connecting to the other products in the 360 suite seamlessly.
- Quick data visualisations due to click and drag interface.
- The list of possible connections is constantly growing, including other areas of the Google stack and 3rd party data connections.
- Quick integrations with other Google Products.
- The flexibility of connections to Google Sheets, File Upload, Big Query and SQL.
- Databases, in case the connector you’re looking for doesn’t exist yet.
Strengths and Limitations of Google Looker Studio
Strengths
- Increasing list of bespoke Google and database connectors.
The google ones are uniquely tailored to Google tools instead
of using APIs. - Dynamic controls that allow viewers to change what data
they’re looking at. - Click and drag interface allows for quick and professional
looking dashboards. - Customizable themes for branding.
- The ability to add multiple data sources to a single report.
- Google Analytics Segments integrated to the GA connector.
- Custom fields feature that allows us to create our own metrics
and dimensions. - Google sheets connector used with Supermetrics allow us to
pull in an even larger number of data sets. - We have built a chrome extension that allows users to make
their reports real-time (if the data source itself is updated in
real-time). - “Unlimited” reports and data sources.
Limitations
- No bespoke data source joining feature (yet).
- Google Data studio functions are not yet as well-refined as those
from BigQuery. - Limited connectors (Community connectors added to help with this)
- No rich media yet only images and links.
- Attribution dashboards can be difficult to build (though not impossible)
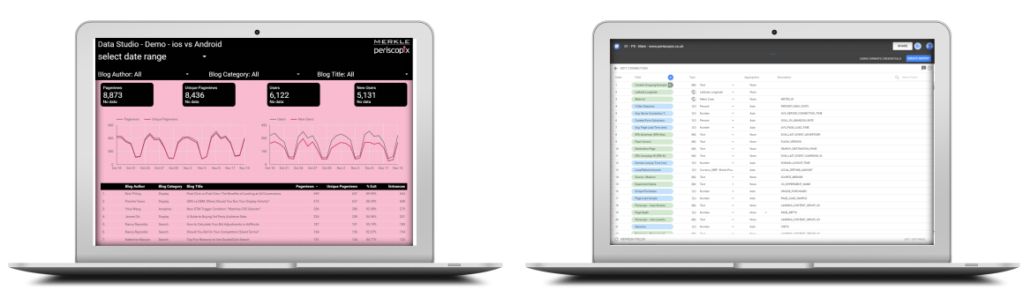
Reports and Data Sources
Reports and Data Sources are two of the key cornerstones of what makes up Google Looker Studio. They are what visualise and pull the data respectively.
Reports in Google Looker Studio
- Reports are where the configuration of your dashboard and the overall visualization is built/designed.
- Reports can be easily shared with other users with either view or edit access.
- Customizable themes and cosmetic features available.
- It’s important to note that the reports themselves don’t hold the data, they just display it.
Creating Reports in Google Looke Studio
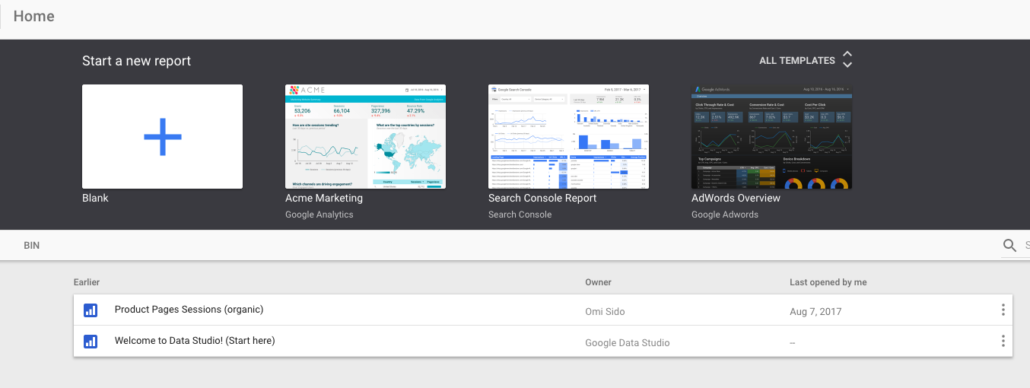
Creating a report In Google Data Studio is a really simple task.
- Start by going to datastudio.google.com and sign in.
- Go to the reports section using the left-hand navigation.
- Just click on the blue plus symbol in the reports section.
- You can also create a duplicate of an existing report by selecting the option under “File” once you’re in the report you wish to copy.
Copying Reports in Google Looker Studio
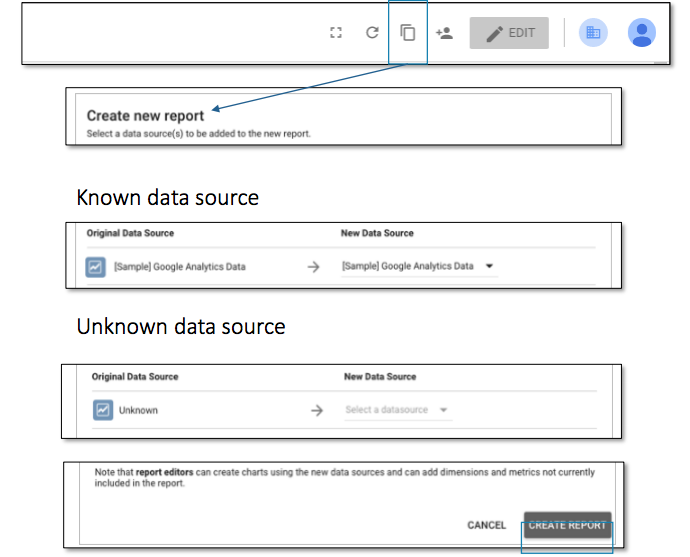
- Select the data source(s) to use in the copy
- If you have at least view access to the original data sources, you can use those.
- If you copy a report that uses a data source that has not been shared with you, you must select a different data source to use.
- The non-shared data sources appear as “Unknown” in the data source selection.
- Create the copy of the report
Data Sources in Google Looker Studio
Data sources are the individual connections that are made from our data in other tools (e.g. Google Analytics, Search Console, Facebook etc.) to our reports.
By default, the data displayed in a report is viewable to anyone who has the link, by using the owner’s credentials. However, this can be changed such that users need to have access to the data to add an extra layer to your data security should you need it.
Data Sources creating a report
Again creating a report is really simple.
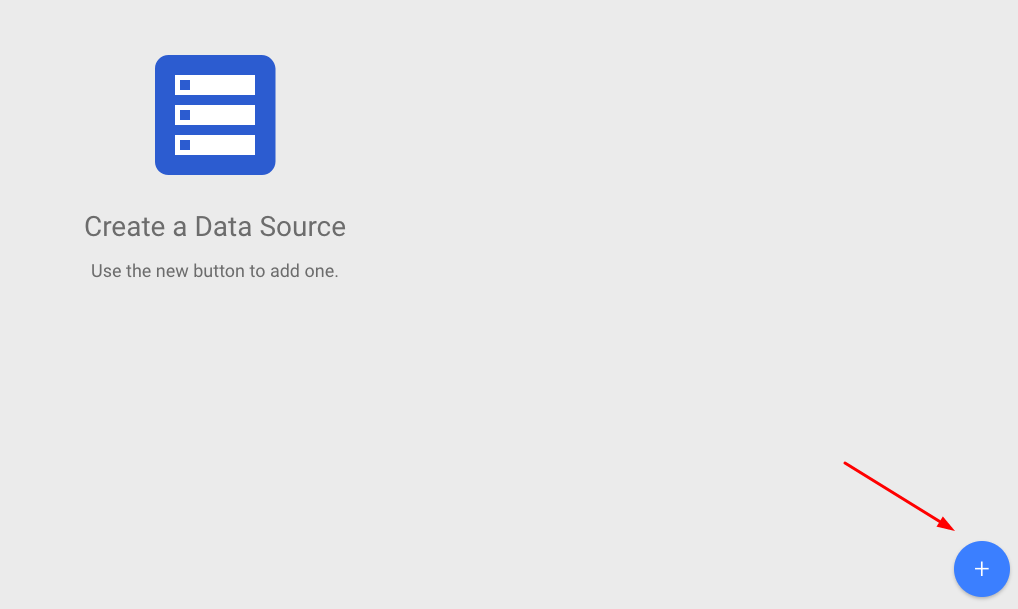
- Start by going to datastudio.google.com and sign in.
- Go to the data sources section using the left-hand navigation.
- Just click on the blue plus symbol in the reports section.
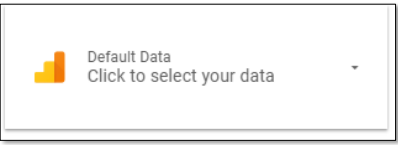
- You can also create a data source when you first create a report. The first stage in building a dashboard in Google data studio is connecting a report to a data source.
Data Sources Connections
- Once you start creating a data source you’ll be given a list of possible connections.
- Your access to different sets of data is based on your access levels for that tool and is based on the same email address used to log into Data Studio.
- You only need view level access to pull data from a connector.
- Once you select a connector type drill down into the view or table of data that you want to connect to.
- Click “connect” and you’ll be given a summary of all of the dimensions and metrics that you’re bringing into the data source. Click Create/Add to report and you’re done.
Note: You can have multiple data sources connect to the same report at any one time, meaning you can see your GA data alongside your AdWords, Big Query or any other connector’s data within the same report.
Community Connectors
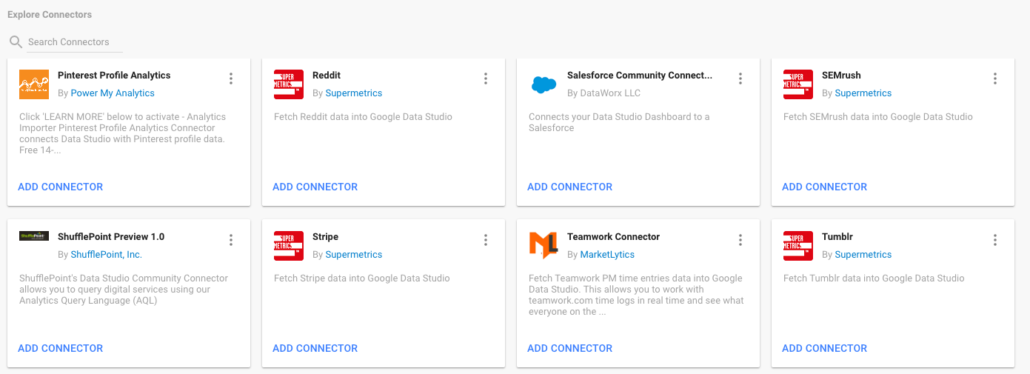
If you can’t find the connector you’re looking for you may be able to find it in the community connectors list.
This list contains connectors for tools that sit outside of the Google stack and work by drawing data from the respective tools’ APIs
You can even create your own connectors with the use of Google Apps Script.
You can access your data from 500+ data sets from over 200 connectors including:
- SEMrush
- PayPal
Data Sources Credentials
By default, the data source will be set as “Using Owners Credentials”. This means that by using this data source in a report, anyone who views the report (perhaps via a shareable link which we’ll come onto later!) will be using the owner’s credentials (the person who created the data source) as opposed to their own.
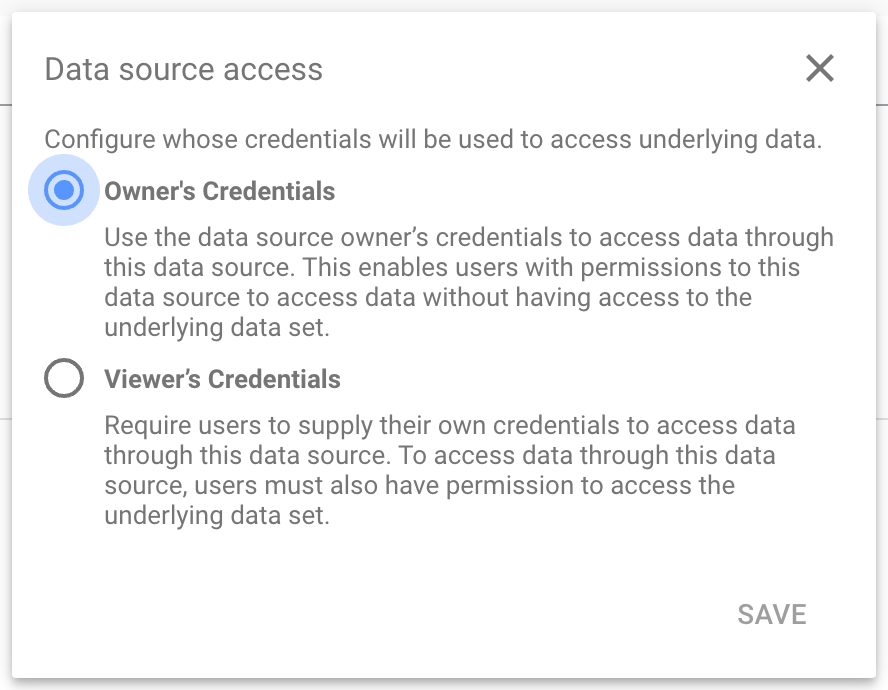
This is really handy if you want to share the report with people internally, without sharing the original data with them (e.g. access to GA or AdWords)
The other option is to use viewer’s credentials whereby the viewer has to have access to the original data set in order to view the data source.
This acts as another layer of security if you want to limit who can see your dashboard. You might want to use this if you only want colleagues who have access to BigQuery (or any other connector) to see your report.
Copying Data Sources in Google Looker Studio
Data sources can only be copied when edited via the DATA SOURCES Homepage.
- Sign in to Google Data Studio.
- On the left, click ‘Data sources’.
- Browse, or use the search box in the upper right, to locate the data source you wish to edit.
- Click that data source.
- In the upper right, click ‘Make a copy of this data source’ button.
- In the confirmation dialogue box, click ‘Copy data source’ blue button.
- If the Connectors panel appears, select the data set for the new data source, then click ‘Reconnect’.
Limits of copying a data source
Copying a data source doesn’t copy or validate the actual data. It only duplicates the data source schema.
If you connect the data source to a different data set from the original, it’s possible that calculated fields may not return the same results as the original data source.
Editing Fields in Reports
You can change field names, aggregations, data types, and analytical functions at the chart level.
When you first create a chart or add new fields to an existing chart, the names, data types, and aggregations of the fields in the chart are the same as they are in the chart’s data source.
- For example, the sessions metric has a ‘number’ data type and an aggregation of Sum.
- By default, the sessions field will appear the same in every chart in which it appears.
- You can change the field characteristics in each widget.
This allows you to include different ways of viewing the same field within a single chart.
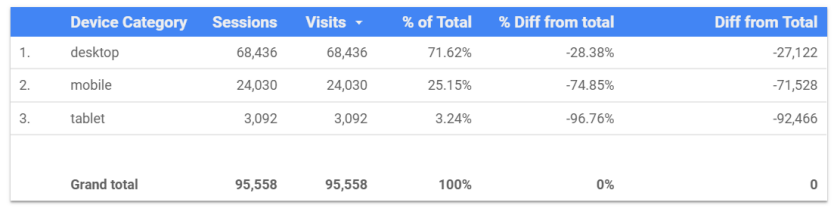
For example, in a table, you can edit the sessions metric to show all of these…
Enabling Editing Fields in Reports
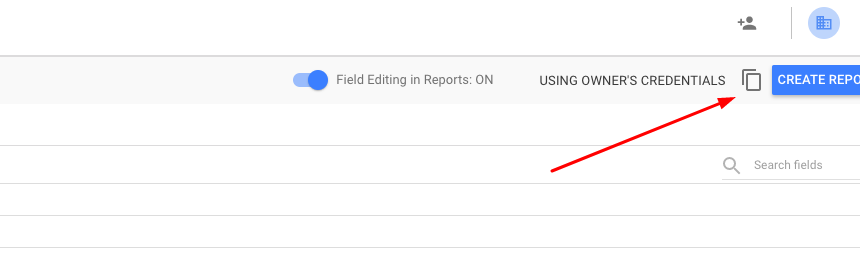
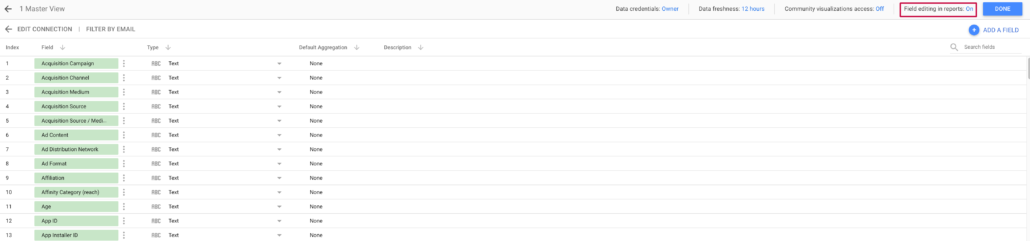
You can toggle the ability to edit fields in the data source settings.
- Edit the data source(s) used in your reports.
- Click the toggle button in the data source header labelled ‘Field Editing in Reports’.
Editing Fields in Reports – What can be edited?
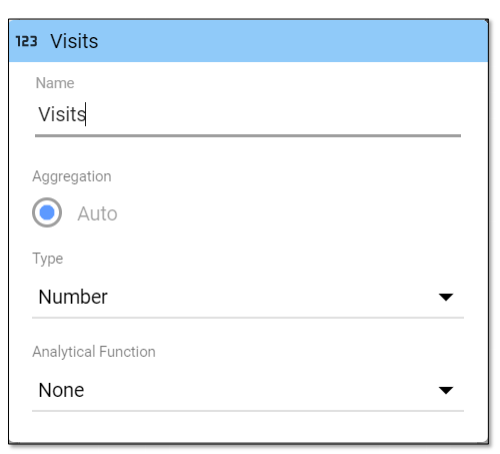
The field’s name.
– For example, you can rename Sessions to Visits. This lets you have
multiple instances of the same field in a chart.
The field’s aggregation.
– For example, you can recalculate Order Value from SUM to AVERAGE. Fields with an aggregation of ‘AUTO’ can’t be changed.
The field’s data type.
– For example, you can convert a Number to a Percent, or Text to a URL.
For date fields, you can change the format.
– For example, you can show a full date (YYYYMMDD) as year month
(YYYYMM).
The field’s analytical function.
– For example, you can apply a Percentage of Total function to your
orders.
Any changes you make to a given field only apply to that instance of the field in that chart, it does not change the field in the data source.
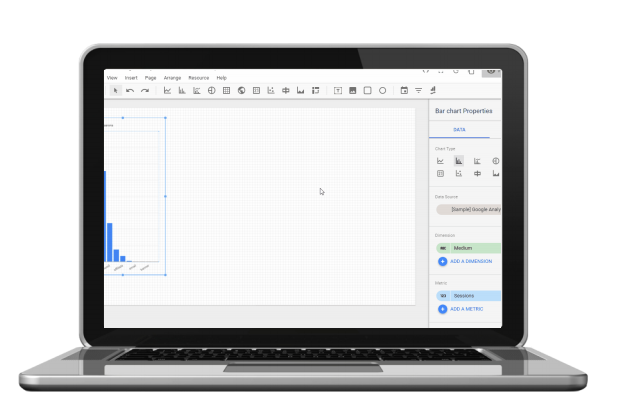
Building a Report in Google Looker Studio
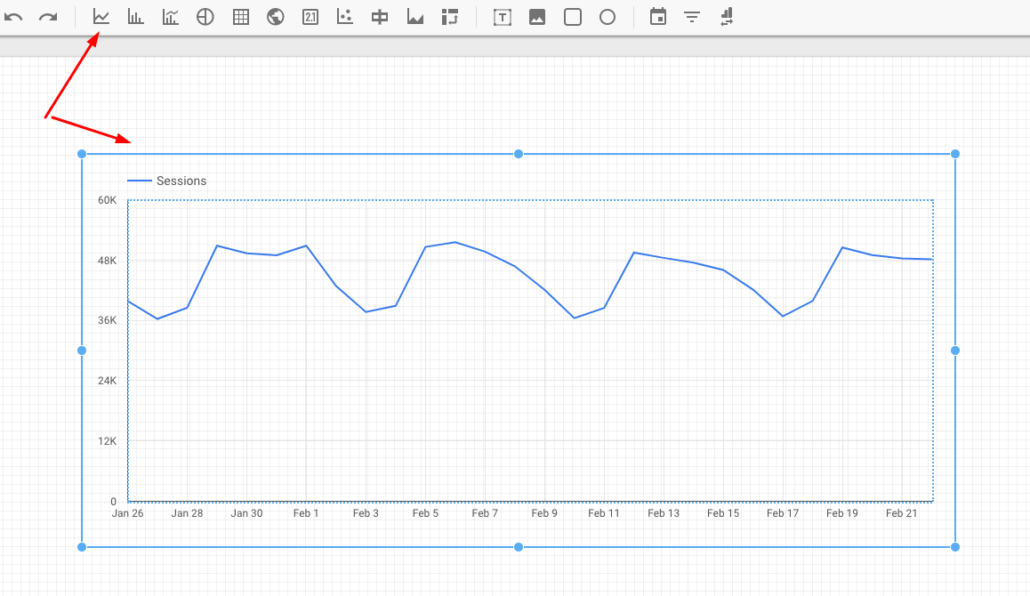
Building you Report – Tools
Once you’ve connected a data source to your new report, it’s time to start building out your data visualisation. The core tools at your disposal are available along the top toolbar.
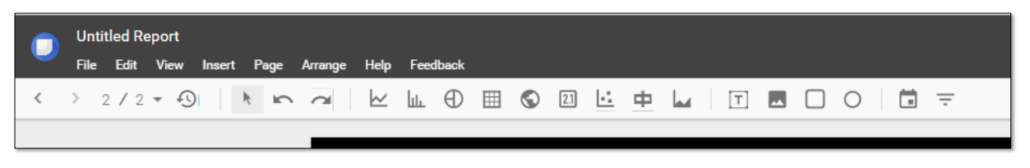
Widgets
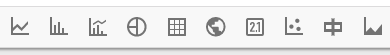
Here lie the options available to you with regards to data visualisation. Time series, bar charts and geo-maps to name but a few of the options available for visualising your data.
Cosmetics
These tools are available to assist you in making your report look more “on brand”. Import images, text and shapes to make your report more visually pleasing.
Controls

These are really cool. Controls allow you to enable users to manipulate the data that they’re viewing, without changing the underlying data.
You can give them the option of changing date ranges or filtering the report by a specific dimension like traffic source for example.
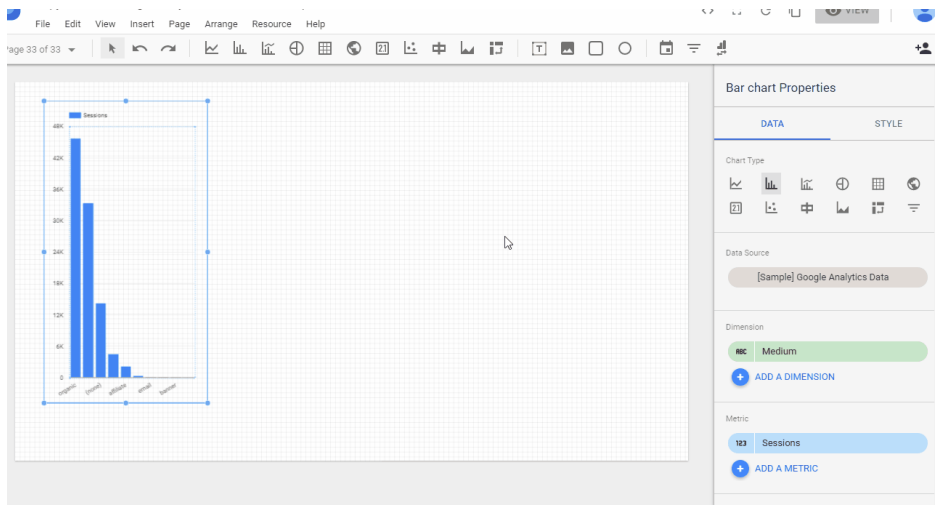
Building you Report – Widgets
Creating reports is really simple in Google data studio, just click and drag once you’ve selected a tool from the toolbar to get started.
Elements that you draw move freely so you can always rearrange your report with ease.
Most widgets have features that can be split into two parts.
The Data section is what determines what part of the data source is used in your widget.
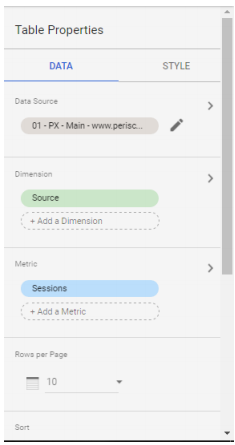
Here you can:
- Apply a different data source
- Change the dimensions and metrics displayed
- Apply sorting methods
- Apply filters to the widget
- As well as some widget-specific options (e.g. adding a breakdown dimension for a time series.)
The Style section is where you can start making your widget more in line with your brand.
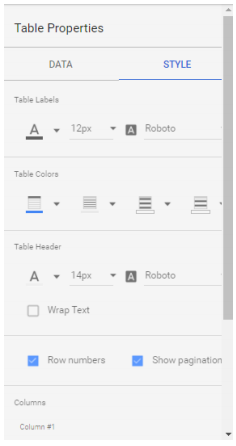
Here you can:
- Use the Google colour pallet as a default or you can add custom colours and make use of the colour wheel.
- Change the formatting of text.
- Apply borders and backgrounds
- As well as some widget-specific options (e.g. setting a scorecard to use compact numbers)
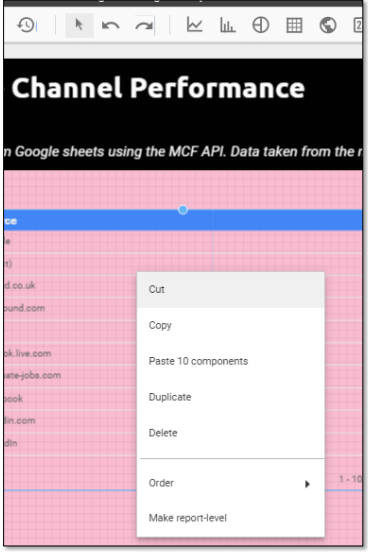
Building you Report – Arranging Widgets
You can move widgets freely in data studio but if you want to have stricter controls of a chart or set of charts those options are available too.
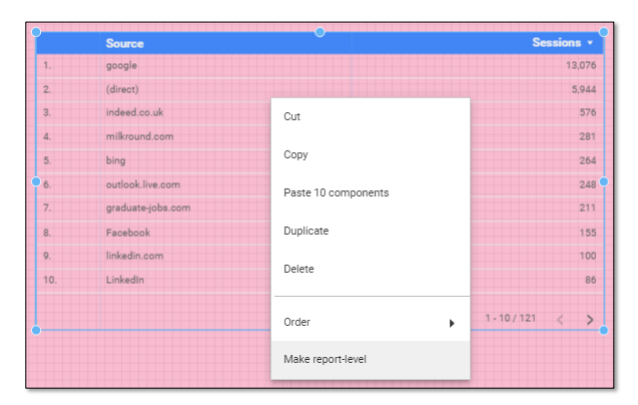
You can make a widget “Report Level” by selecting the option after right-clicking the widget. This will cause that widget (and any subsequent changes to it) to appear on all pages of your report. This is most useful when used on logos, header and controls, things that you would want appearing consistently throughout the report.
You can also select multiple widgets and have them align with one another by selecting multiple widgets (by either clicking and dragging a box around them or by using Shift+click).
Once selected got to Arrange on the top navigation options. From here you can choose how to align or distribute your data visualisations.
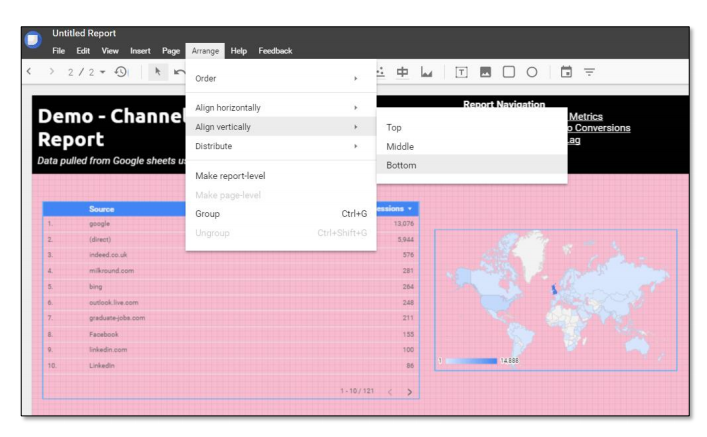
Options available are:
- Order: Push an element into the background or move it forward.
- Align: make the elements selected align vertically or horizontally.
- Distribute: Spread the elements evenly between the two furthest widgets
Another powerful feature at your disposal is what’s called Grouping.
Grouping lets you group (Surprising) widgets together so that they move as one.
Not only that but they act much like a sub-report:
- You can assign a different default data source to groups
- Filters and controls that are used in a group only affect the elements in said group, meaning that you can split a page into two parts and have users control the data visualisations for each part independently of one another
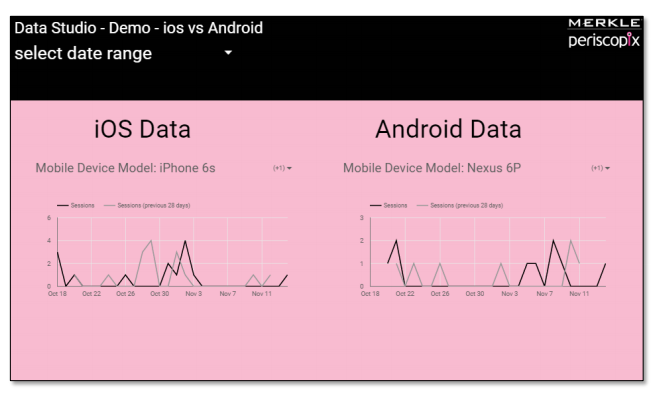
You can group elements together by selecting them and using the option under the Arrange menu or by pressing Crtl+g (Ctrl+Shift+G to ungroup).
Building you Report – Report Settings
For more report wide changes go to: File>Report and Theme Settings
Layout: This lets you choose the orientation of the report as well as letting you choose where report level widgets get placed (Top or Bottom)
Theme: This acts much in the same way that the “style section does for widgets, letting you apply cosmetic changes at the report level.
Data: This acts much like the data section of widgets but at the report level, letting you apply a default data source and enable caching to make your report run faster when you first load it up.
Building you Report – Sharing
Sharing in Data Studio works in a similar way to Google Sheets. You can produce a shareable link or email users individually with access.
The share button can be found in the top right-hand corner.
An important point to note is that a created link can only have one of two settings applied.
- View: Users who have the link can view but not edit the report’s configuration.
- Edit: Users with the link can view and edit the report’s configuration.
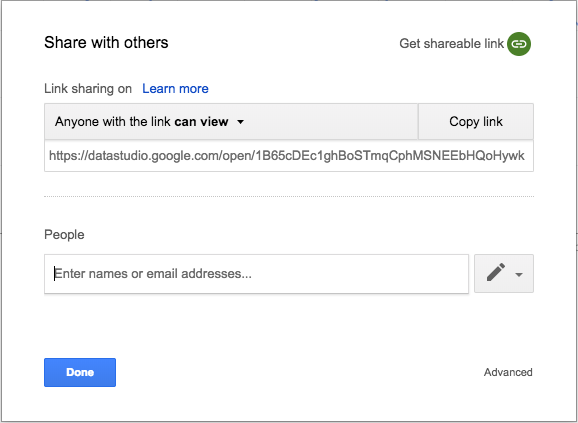
This is important! If you send out a link with view access and then one with edit access both sets of links will have edit access. In this scenario, it’s better to use the email option instead.
Building a Report in Google Looker Studio – Advanced Examples
Pivot Tables in Google Data Studio
Pivot tables take the rows in a standard table and pivot them so they become columns. This lets you group and summarizes the data in ways a standard table can’t.
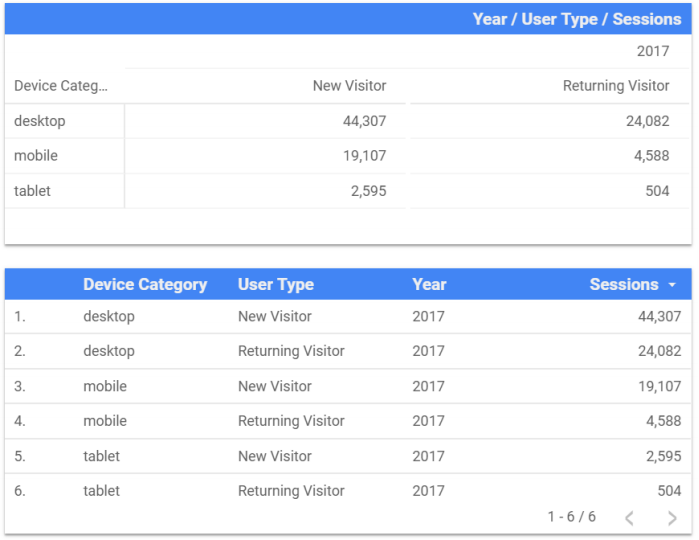
In terms of Google Analytics (GA) data, you can only pivot dimensions, not metrics.
Limitations
- Pivot tables can process up to 50,000 rows of data and can degrade dashboard performance.
- You may have only 1 pivot table per page in a report.
- Pivot tables do not paginate, as do standard tables.
- You can’t apply metric filters to pivot tables.
Canvas Size in Google Looker Studio
The size of the canvas on which you create the dashboard can be changed. There are 4 standard options and a custom option:
- US letter – 4:3 – Portrait
- US letter – 4:3 – Landscape
- Screen – 16:9 – Portrait
- Screen – 16:9 – Landscape
- Custom – You can specify the exact width and height you want in pixels
Better view Canvas Size
Colour In Reports
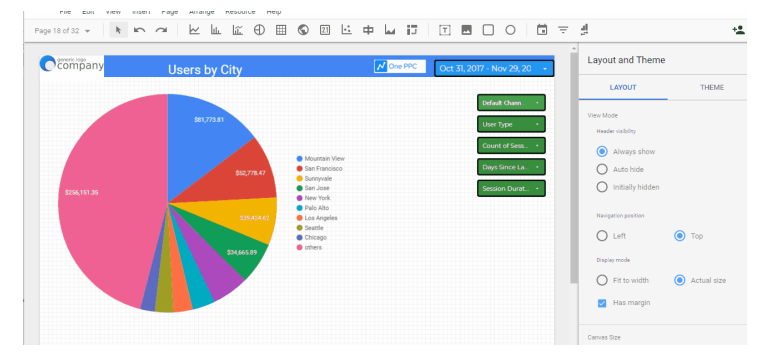
You can choose how to colour the data in your reports:
- Colour by Dimension Value, E.g. France will always be represented as Blue. This is the default behaviour.
- Colour by order, the first series of data will be blue.
- Use different shades of a single colour
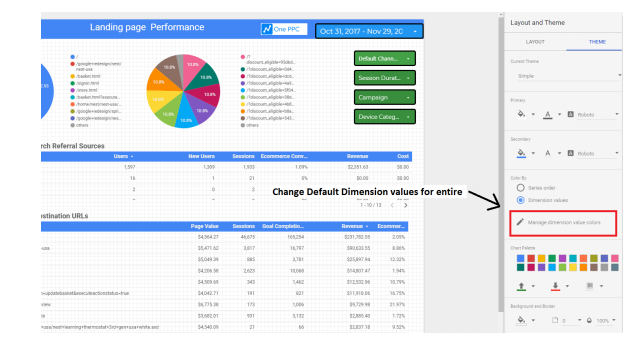
Change behaviour for all charts
You can do apply the same behaviour, except apply it to all reports in a dashboard.
- Edit Report.
- Click on the report then select the theme panel.
- Under the Colour by options, select the new default behaviour.
You can change the default theme of the report.
- Edit Report.
- Click on the report then select the theme panel.
- Under the Current theme, you can change the theme of the dashboard.
- Only simple and simple dark available by default, but you can create your own in chart palette.
Embedding Reports in Google Looker Studio
You can embed a report using an HTML iframe in a page. The iframe contains a special link to the report. This link is generated by Data Studio when you enable embedding for the report.
You can embed public and private reports:
- If the report is shared publicly, then anyone viewing your page can see the embedded report.
- If the report is shared with specific users, groups, or domains, then only those folks can see the embedded report.
These viewers must be logged into a Google account.
Embedded reports appear in the iframe in view mode.
Embedded reports are fully functional, but users can’t edit, copy, or share them, as there is no menu bar.
Viewers can’t refresh the data in an embedded report. (The data will refresh as usual when the cache expires.)
Page navigation for multi-page reports appears in the bottom of the report.
Viewers have options in the bottom of the report
- A link to see it in Data Studio
- A button to view the report in fullscreen mode
Segments
Segments are a feature in Google analytics that allows you to group
users and sessions based on a series of conditions. They are a great
way to gain insights into your data and now you can pull them into
Data Studio.
You are only able to add a segment to a report if you have access to it
in GA. Once a segment is added to the report, all other
editors/viewers of this report can use it (in a similar way to a Data
source).
GA segments will be kept synchronized with Data Studio when:
- A user clicks the refresh data button.
- Cache expires and is refreshed.
- If Data Studio requests the data for some other reason.
- This feature can be switched off by going to Resouces>Segments.
When you copy a widget or a report different things will happen to the segment depending on whether or not you have access.
Component
- If you have access:
- If you don’t have access
Report
- If you have access
- If you don’t have access
Segment Limitations:
- You can only apply one segment per widget.
- If you change the data source of a widget that has a segment on it Data Studio will keep the segment
applied and won’t be able to intelligently tell you that the segment isn’t compatible with the new view so
be conscious of how you use it.
Google Data Studio Tips and Tricks
Tips and Tricks – Link Navigation
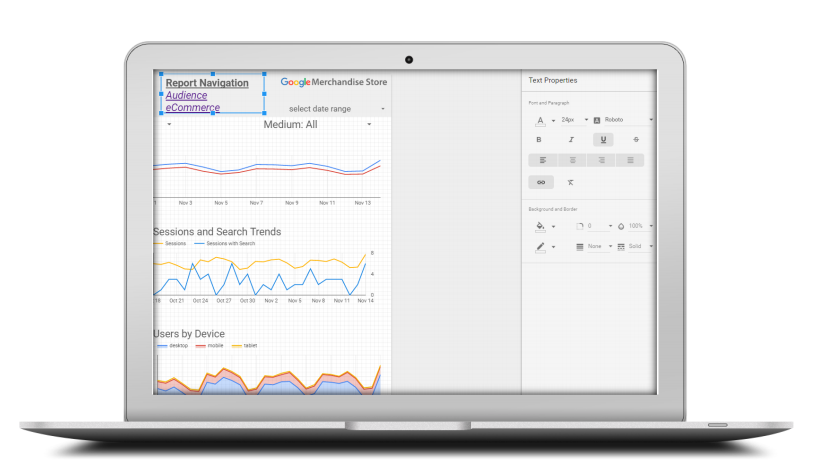
Make use of links in text widgets.
You can link to other pages in the report, building up your own contents list within the header of your page.
You could even have the first page be a contents page to separate reports with a “go back” feature on the rest of the pages.
Tips and Tricks – Keyboard Shortcuts
The same shortcuts that are available to you in Google sheets are available to you in Data Studio. The most helpful ones are:
- Ctrl+c – Copy
- Ctrl+v – Paste
- Ctrl+x – Cut
- Ctrl+a – Select all
- Ctrl+z – Undo
- Ctrl+y – Redo
This allows you to copy/paste entire page configurations, saving you time. There are however traditional options in the form of right-clicking a widget or selecting undo/redo in the main toolbar.
Tips and Tricks – Real-Time Reporting
Real-time reporting isn’t natively supported in Data Studio but fortunately, there is a chrome extension that can enable the functionality.
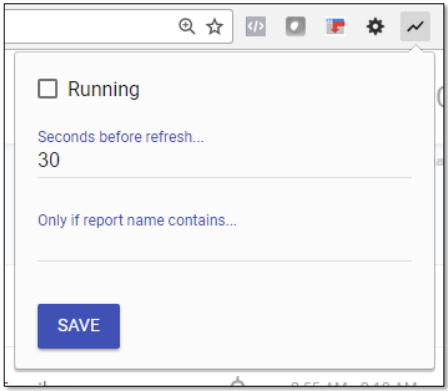
Just search for real-time data studio as a chrome extension.
Set how often you want the data source to refresh and if it should only apply to one report in particular
Make sure your data source is real-time otherwise this extension won’t work as expected.
Tips and Tricks – URL Field Type
When you create a data source, Data Studio will detect valid URLs in the data set and assign the URL field type to that dimension.
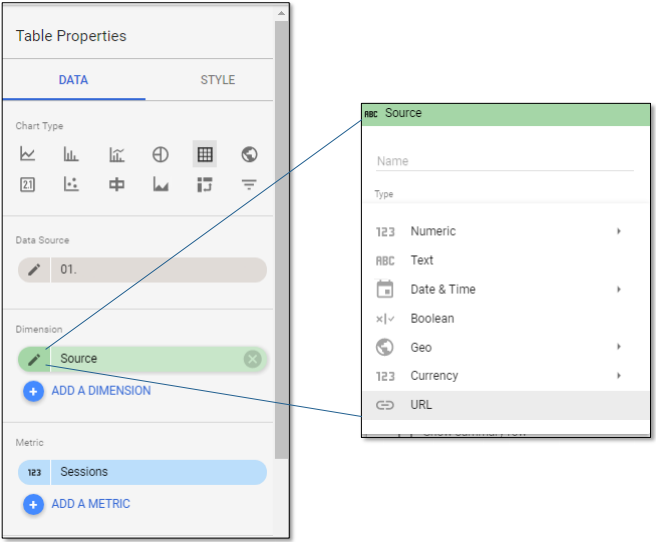
If the URLs are not detected automatically: You can set the field type to URL manually.
*URL fields display the full link in charts. In tables, this link is clickable.
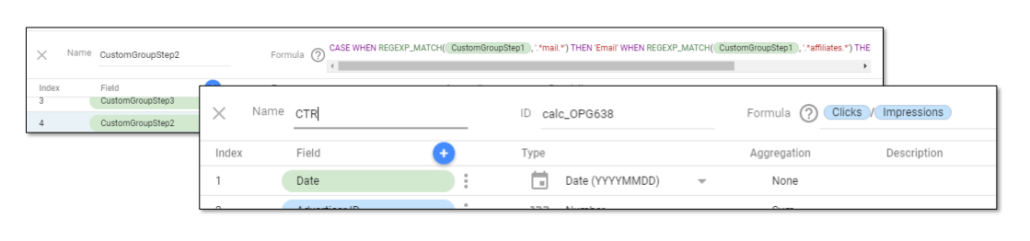
Tips and Tricks – Calculated Fields
You can build your own calculated fields if you have edit access to the data source you want to add it to.
This can be used to create your own Metrics and Dimensions.
You may want to use this to build ROI metrics or your own custom channel groupings
Functions list can be found here: https://support.google.com/datastudio/table/6379764
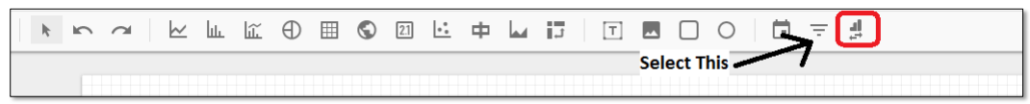
Tips and Tricks – Data Control
Sometimes we might want to see what the dashboard and visualisations look like across different views or maybe you saw a good dashboard and you want to see it represent your own data.
Now with Data control, you can pick the data source you want, while the original added data source will remain as the default.
This saves you remaking the dashboard with the data you want as the data source.
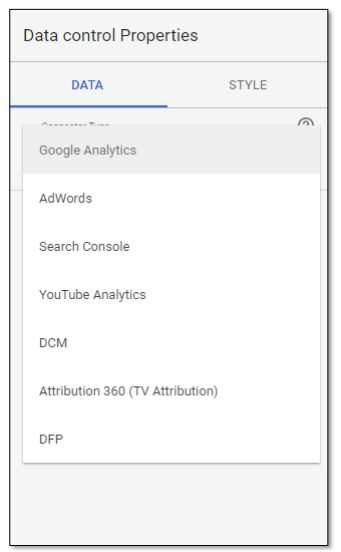
There are 7 types of connectors to choose from:
- Google Analytics (of course)
- AdWords
- Attribution 360 (TV Attribution)
- DFP (DoubleClick for Publishers)
- DoubleClick Campaign Manager
- Search Console
- YouTube
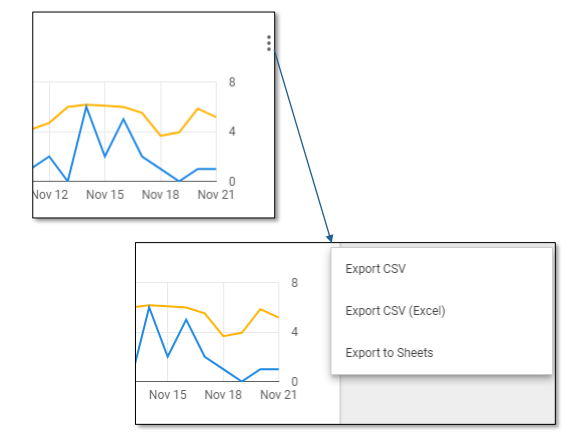
Tips and Tricks – Export data from a chart
To export data from a chart:
- Data Export is available in View Mode.Only the data available in the chart is
exported. - Any filters, date range controls, or
Google Analytics segments currently in
place are also applied to the exported
data. - Pagination has no effect on export. All of the table rows are exported.
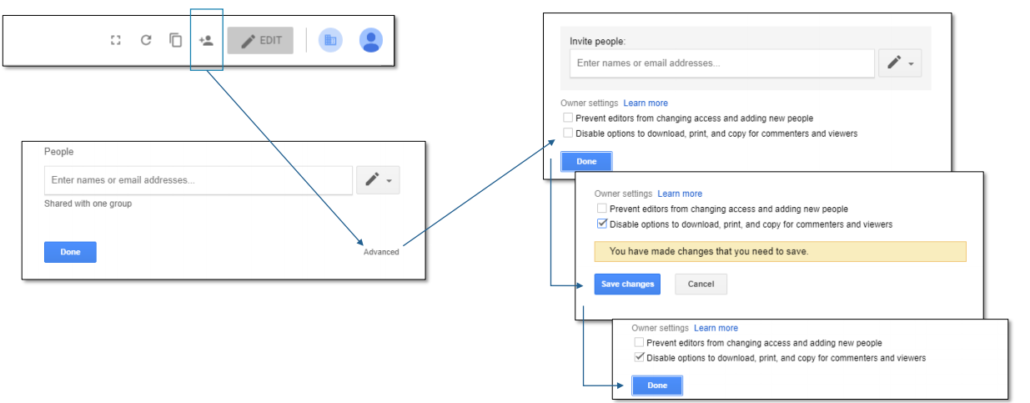
Tips and Tricks – Export data from a chart – How to disable
By default, data export is enabled. In order to disable the option for the entire report:
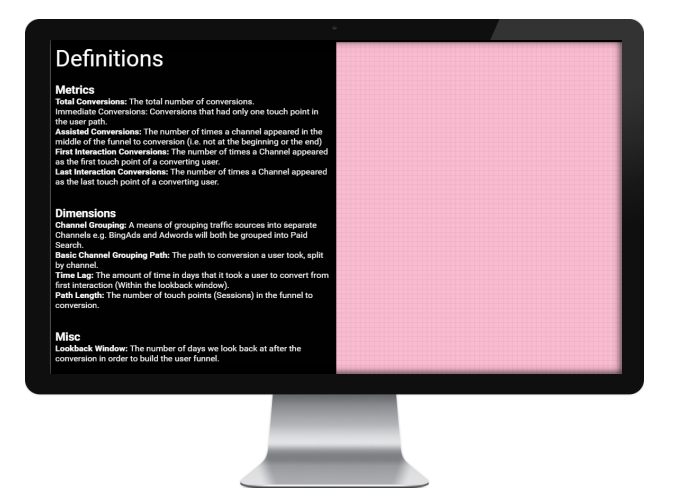
Tips and Tricks – Definitions
If you’re planning on sharing this to a wider team it can be handy to have a definitions page or appendix at the end so users don’t bombard you with questions about what the different dimensions and metrics mean.
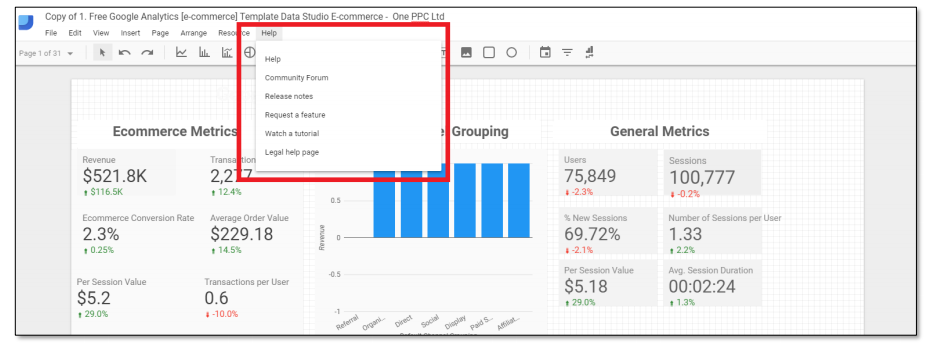
The Help tab in Google Data Studio
The Help tab at the top of the page contains a number of very useful features.
- Help
- Community Forum
- Release Notes
- Request a feature
- Watch a tutorial
- Legal help page
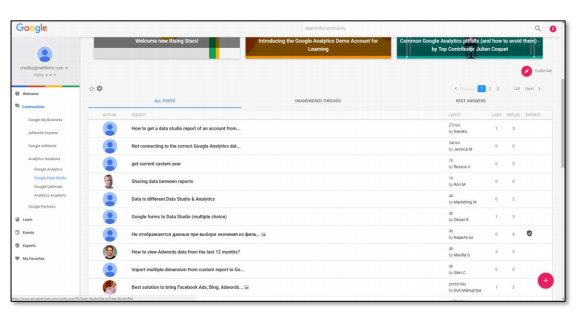
Request a feature & forum
You can view the community forum for FAQ’s or to ask your own questions. The community is very friendly and active.
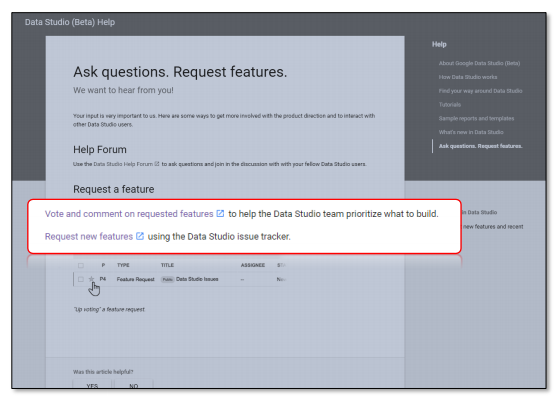
“Request a feature” option, takes you to another page and asks if you would like to vote and comment on feature request already made, or to make a request of your own.
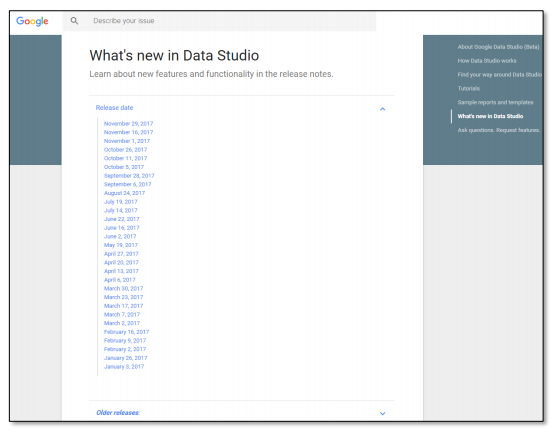
Release notes & Watch a tutorial
If you click the Release notes option, you will be brought to a page with all the new features and changes listed by date of release.
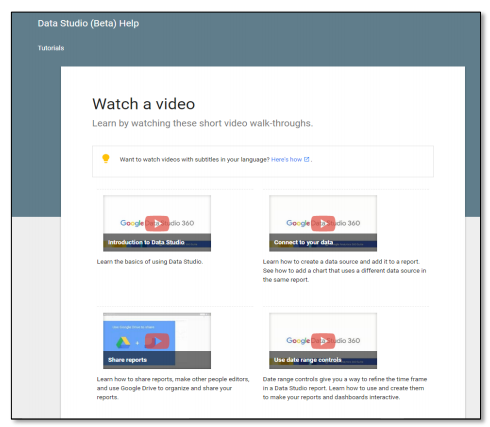
“Watch a tutorial” provides a number of YouTube videos on how to do some useful functions in Data Studio such as filter controls, share reports, calculated fields etc.
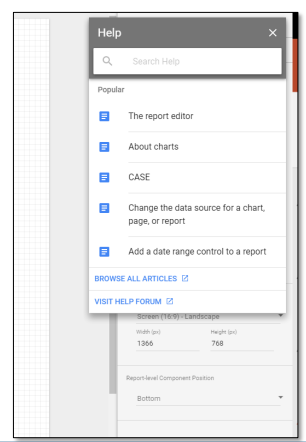
Help & Legal Help
The Help option brings up the pop-up of the data studio help centre
(https://support.google.com/datastudio/?hl=en#topic=6267740)
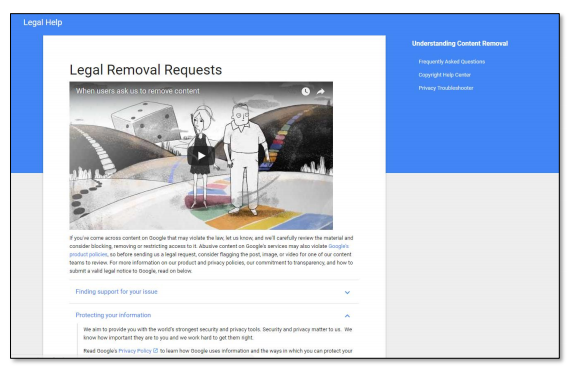
The legal Help page is where you can report harmful, illegal or abusive content. Also where you can find privacy policies and copyright stuff!
Data Studio VS Google Analytics Dashboards
Google Data Studio Dashboards
- Data Sources!
- 50 widgets per page (no page limit).
- Tables can have up to 5 dimensions and 25
metrics - Customizable themes and layouts
- Filter and date range controls
- Difficult to make real-time reports (Though
definitely possible) - Custom fields
- 9 data visualizations
- Open Sharing
Google Analytics Dashboards
- GA Data Only
- 12 widgets per dashboard
- Tables can have 1 dimension and 2 metrics
- Weak customizable options
- Only date range controls
- Easy to make a real-time report
- Custom Metrics
- 6 data visualizations
- Requires GA access to share dashboards
How can we add more than 40 dimensions and 40 metrics in google data studio