
Google Analytics 4, also known as GA4, is a powerful web analytics tool that provides businesses with valuable insights into their online performance. GA4 is an improved version of the classic Universal Google Analytics (that we all loved), which was primarily used for tracking website traffic and user behaviour. One of the key features of GA4 is the ability to measure engagement metrics, including ‘engaged sessions’ and bounce rate. To explain the bounce rate in GA4 first we have to explain the so-called ‘engaged sessions’ in Google Analytics 4 so let’s start with this one.
What are Engaged Sessions in Google Analytics 4
Let’s start with a short answer and then we can have a longer description.
Engaged sessions in GA4 are defined as sessions that last for 10 seconds or more and include at least one conversion event or two or more page/screen views.
Engaged sessions in GA4 refer to the length of time a user spends actively interacting with your website or app. An engaged session is defined as a session where a user spends at least 10 seconds actively engaging with the content on the page. This includes actions such as scrolling, clicking, or watching a video. Engaged sessions are a valuable metric because they indicate how interested and invested users are in your website or app.
How to change the web session timeout in Google Analytics 4 (GA4)
If you think that 10 seconds is too low to count a session as an ‘engaged session’ you can configure and customise your engaged session by increasing this time to up to 60 seconds.
To change the default timeout of 10 seconds for your engaged sessions follow these steps:
- Sign in to your GA4 account and select the property you want to configure.
- Click on “Admin” in the left-hand menu.
- In the “Property” column, click on “Data Streams”.
- Select the data stream you want to configure and click on “Settings”.
- Scroll down and click on “Configure tag settings” under ‘Google tag’.
- In the Google Tag section, click Show All to see all available options.
- Click “Adjust session timeout”.
- Set the engagement time threshold that you want to use. This is the amount of time that a user needs to spend on your website to be considered engaged.
- Click on “Save” to save your changes.
Why are engaged sessions important?
Engaged sessions are important because they give businesses a better understanding of how users interact with their website or app. Tracking engaged sessions can help you answer important questions like:
- How long are users staying on my website?
- What content are users most interested in?
- What actions are users taking after arriving on my website?
Engaged sessions are also a useful metric for measuring user engagement over time. By tracking engaged sessions over weeks or months, you can get a sense of whether your website or app is becoming more or less engaging to users.
Another benefit of engaged sessions is that they can help digital marketers identify areas for improvement. If you notice that your users are spending very little time engaged with your website or app, it may be an indication that your content is not as engaging and authoritative as it could be. On the other hand, if your users are spending a lot of time engaged with certain pages or content, it may be an indication that those pages are particularly effective and should be emphasised.
Tips for optimising engaged sessions
Once you start tracking engaged sessions in Google Analytics A4, there are several strategies you can use to optimise this metric and improve user engagement on your website or app. Let me give you a few tips to get you started:
- Focus on creating engaging content: As I mentioned earlier, engaged sessions are a good indicator of how interesting and compelling your content is to your audience. By focusing on creating engaging content, you can increase the likelihood that users will spend more time on your website or app.
- Optimise page load speed: I am sure that you already know that users are more likely to engage with your website or app if it loads quickly. Slow loading times can be a major barrier to engagement, so it’s important to optimise your page load speed by compressing images, minimising HTTP requests, and using caching tools. And of course, let’s not forget that although page speed is not a direct ranking factor it ‘generally aligns with success in search ranking and is worth your attention’.
- Improve website navigation: Visitors to your web properties are more likely to engage with your website or app if they can easily find what they’re looking for. Make sure your site navigation is easy to use and intuitive, with clear labels and logical organisation.
- Personalise the user experience (UX): Personalisation can be a powerful tool for increasing user engagement. Use data from Google Analytics 4 to create personalised experiences for users based on their interests, behaviour, and preferences.
- Experiment with different content formats (this one also goes well with ‘personalised user experience’): Different types of content can be more engaging to different users. Experiment with different content formats, such as videos, infographics, or interactive tools, to see what resonates with your audience.
- Monitor user feedback: Keep an eye on user feedback, such as comments, reviews, or social media posts, to get a sense of how users are engaging with your website or app. Use this feedback to make improvements and optimise the user experience and content on your website.
Engagement metrics in GA4
Now that we understand what ‘engaged sessions’ are let me show you where to find certain engagement metrics in GA4.
Engaged sessions in GA4
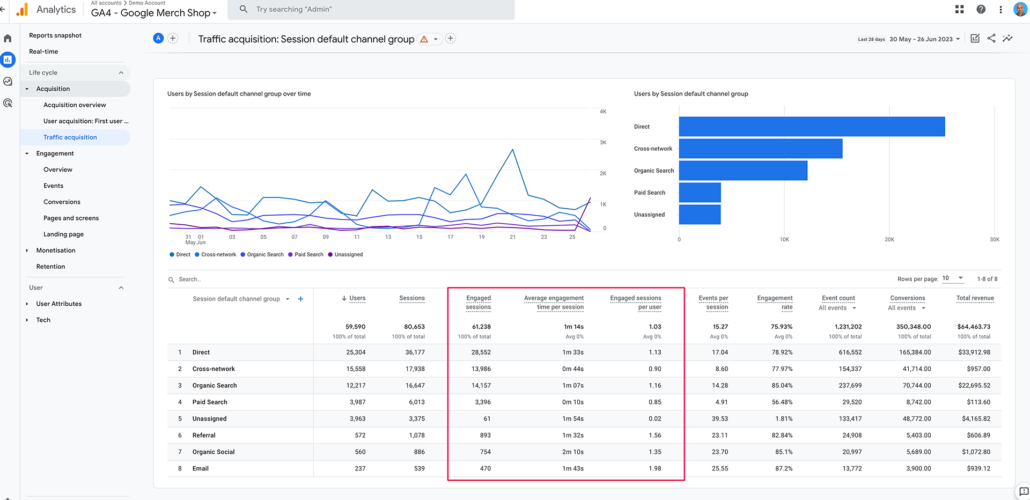
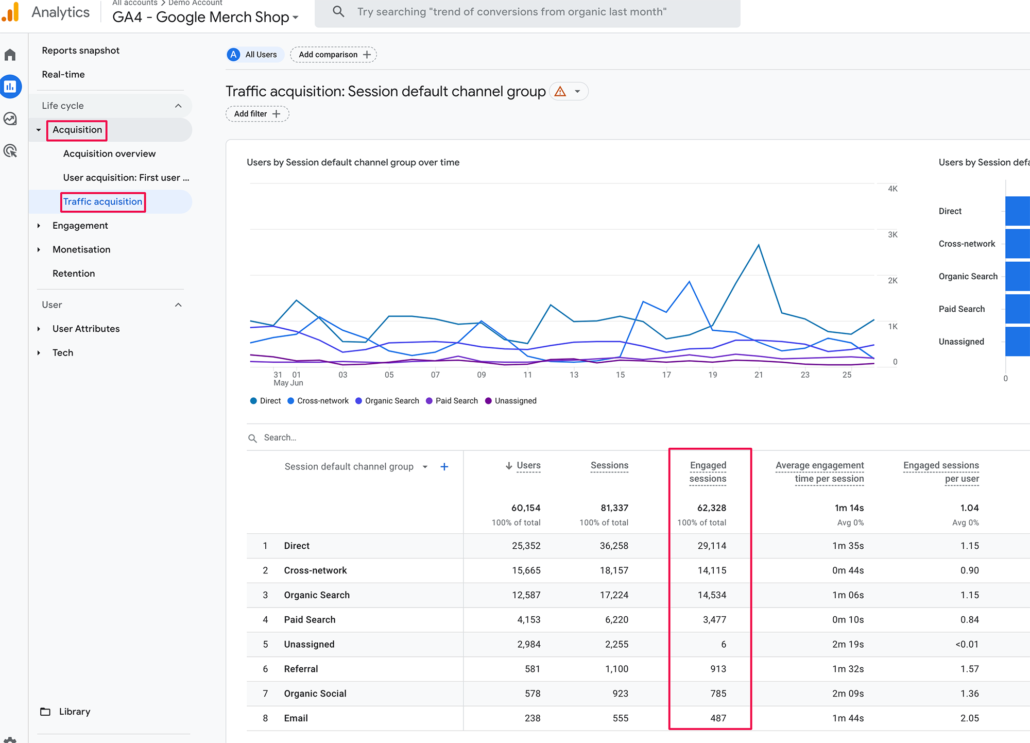
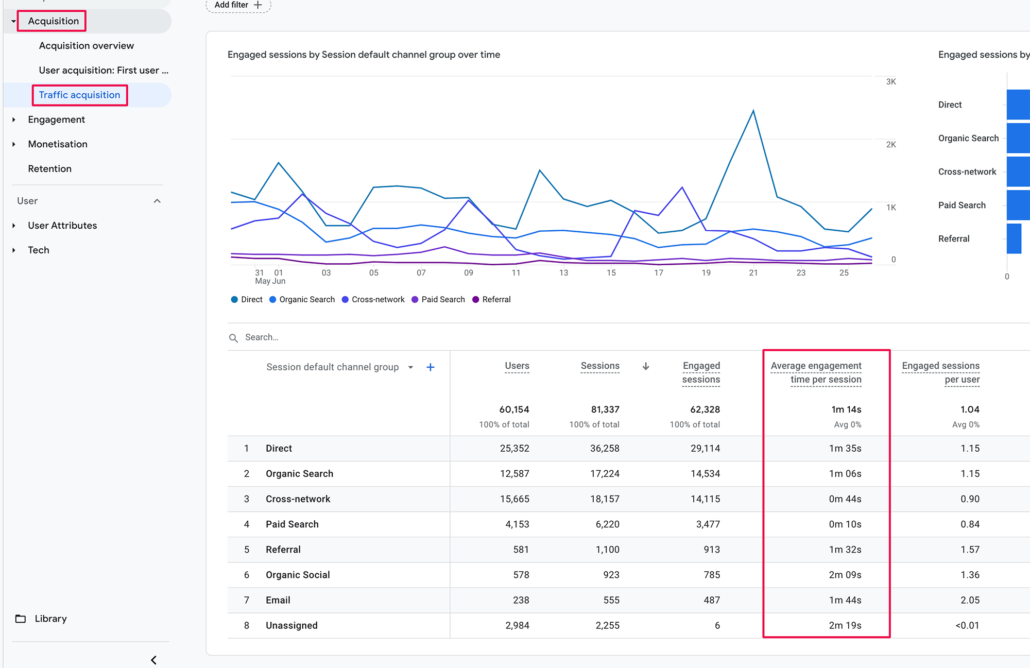
Go to Reports in Google Analytics 4 and then Acquisition and Traffic Acquisition and the first engagement metric that you will see is Engagement sessions. By the way, Sessions here means all sessions including Engaged sessions and sessions that were not engaged.
Average engagement time per session
The next metric is the Average engagement time per session – all engagement time is combined and then divided by the number of sessions. This metric is very similar to the ‘average time on page’ metric in Universal Analytics but in comparison, the Average engagement time per session is a lot more precise.
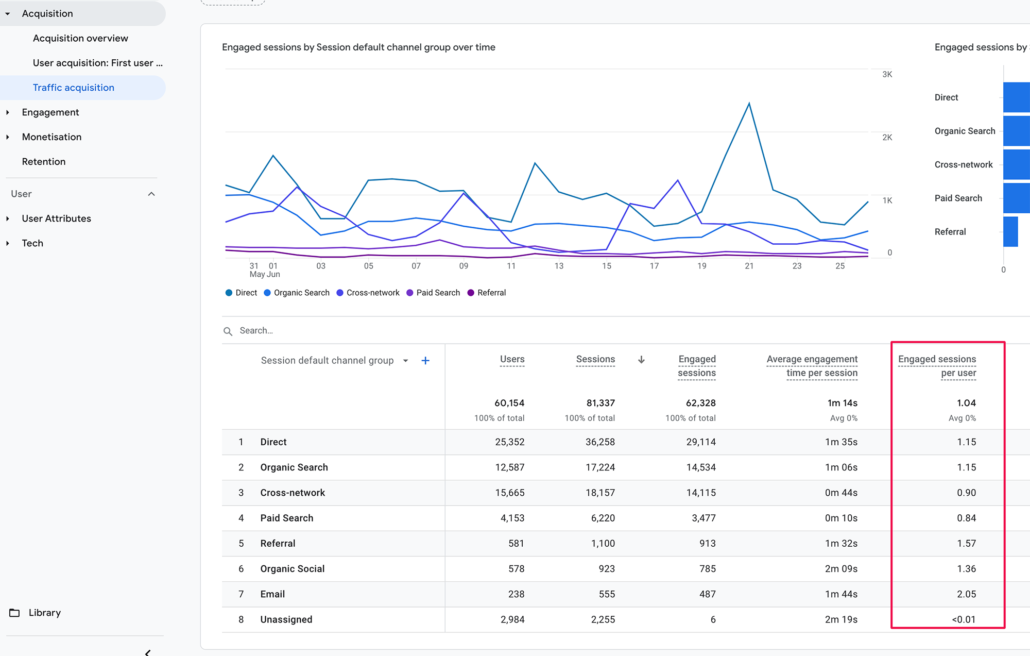
Engaged sessions per user
The next metric that we see in this report is Engaged session per user. This metric is calculated by taking the total number of engaged sessions per user and dividing it by the total number of users. This ratio is useful for digital marketers and analysts to track over time. A higher value indicates that the site has more engaged users.
Engagement Rate in Google Analytics 4
Last but not least we see the Engagement Rate metric that is a good metric to look at but similar to Bounce rate in Universal Analytics it should never be analysed in isolation.
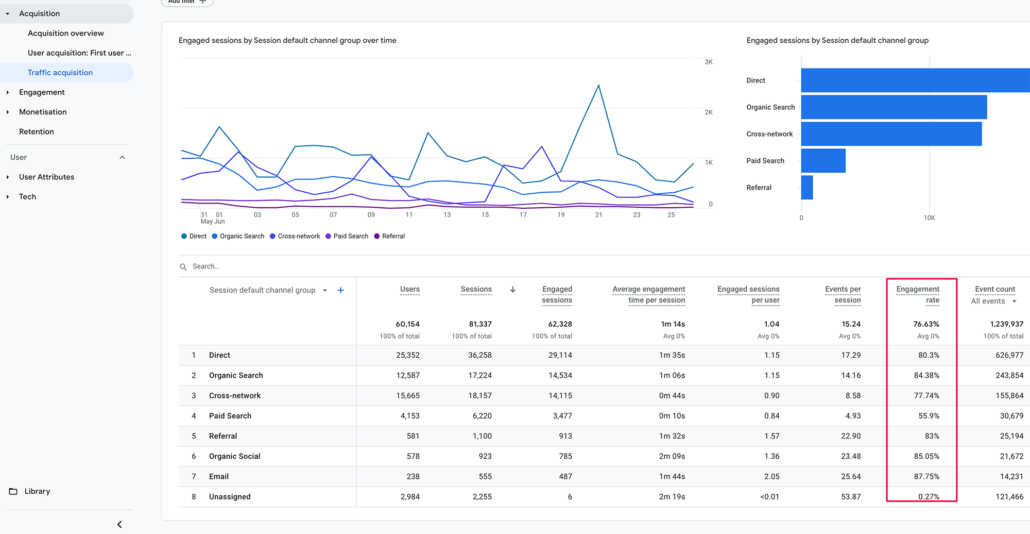
What is ‘Engagement rate’ in GA4 (Google Analytics 4)
Engagement rate in GA4 (Google Analytics 4) is a metric that measures the level of user interaction with your website or mobile app and essentially replaces Bounce rate in GA4. It is calculated by dividing the total number of engaged sessions by the total number of sessions and then multiplying the result by 100.
Engagement rate = Number of Engaged Sessions / Total Number of Sessions * 100The engagement rate helps you understand how effectively you are engaging your audience and can provide insight into how you can improve your website or app’s user experience.
Engagement rate is a valuable metric to track over time and can be used to inform your marketing and website optimisation strategies.
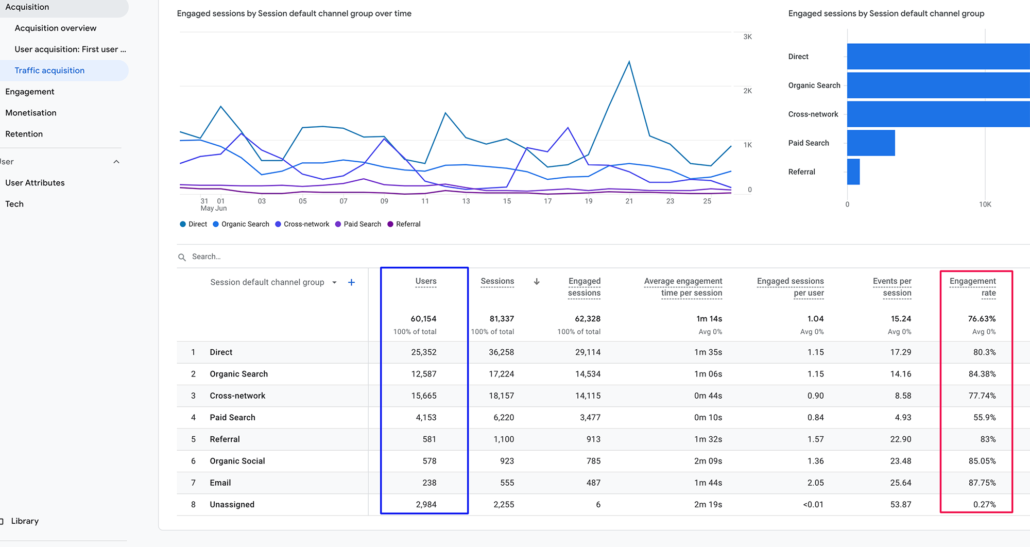
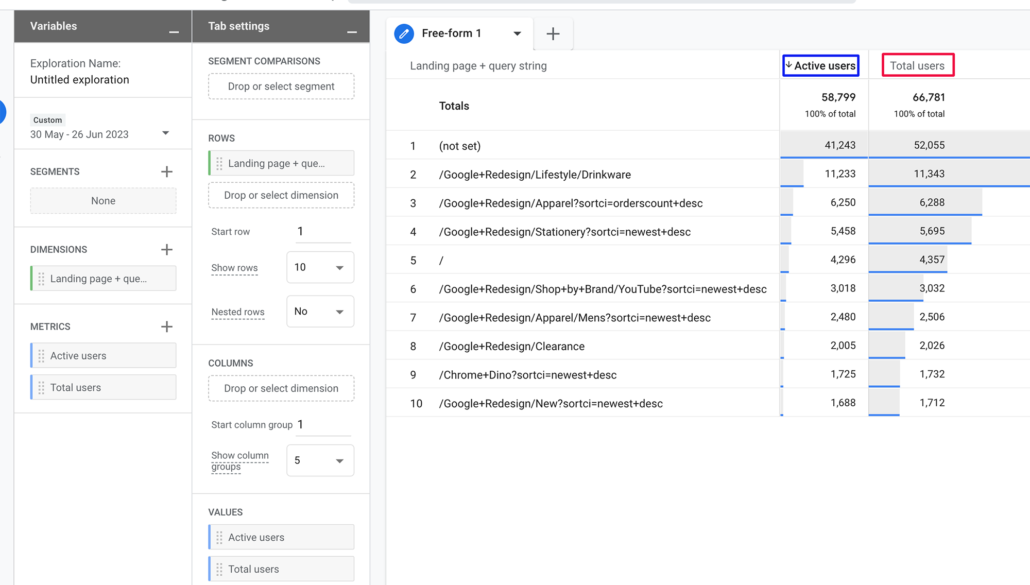
Note: Before going any further I have to mention a very important thing in this report: Users in this report shows only the number of Active users – an Active user is a user who has at least one engaged session – compared to Universal Analytics where the metric Users gave us the total number of users landing on your website pages.
In other words, in Universal Analytics if a person came to your website and stayed for 2 seconds only that user would still be counted in the Users metric. In GA4 only Active users are counted so if you compare the Users metric between UA and GA4 the numbers will definitely not match and most likely the GA4 numbers are lower.
If you still want to see the Total number of users and Active users you should go to the Explore section of GA4 and select the metric Total users which will give you the number of unique users that have sent at least one event to your property and strictly speaking don’t have to be engaged.
What is a good average engagement time?
It’s important to keep in mind that engagement rates can vary significantly across different websites, industries and target audiences. What may be considered a desirable engagement rate for one industry or audience may not necessarily be the same for another.
The industry and target audience are critical factors that must be considered. Various industries and audiences exhibit distinct behaviours and expectations when it comes to interacting with websites and applications.
For example, the average engagement rate for B2B websites is typically around 63%, whereas B2C websites tend to see an average engagement rate of 71%. The difference in engagement rates between these two industries may be due to differences in product or service complexity and the purchasing process. As a result, it is essential to compare your website’s engagement rate against that of your competitors in your industry to determine a reasonable engagement rate benchmark.
Now that we know what ‘engaged sessions’ and ‘engagement rate’ are it will be very easy to explain bounce rate in GA4.
What is bounce rate in Google Analytics 4 (GA4)
Bounce rate in Google Analytics 4 is the percentage of sessions that were not engaged sessions.
Another way to explain Bounce rate in GA4 is if the following 3 actions do not occur during a session, it will be considered a bounce
- A session consists of 2 or more page_view events
- A visitor stays at least 10 seconds on a page
- A conversion happened during the session
When you think about it Bounce rate in GA4 is the inverse of the Engagement rate metric and you can calculate it using the following formula:
100% - engagement rate = Bounce rate Example: If you had a hundred sessions in total and out of those hundred, seventy were considered ‘Engaged Sessions’ then the bounce rate recorded in GA4 would be 30%. As simple as that.
Great, now that we understand how bounce rate is calculated in Google Analytics 4, it seems to be missing from my reports. Where exactly can we locate the bounce rate? That’s a great question, let’s explore and find the answer!
How do you see the bounce rate in GA4?
To access the bounce rate in GA4 reports, follow these steps:
- Navigate to the left menu and click on ‘Reports’.
- Choose the specific report you wish to customise, e.g. Landing pages under Engagement.
- Look for the ‘Customise report’ button located in the upper-right corner of the report (Note: if the button is not visible, it means you do not have the Editor or Administrator role.
- In the Report data section of the right panel, click Metrics and then ‘Add metric’.
- Find “Bounce rate” and click on “Apply.”
- If you want this update to be applied every time you view the report, select ‘Save changes to the current report’ by hovering over the blue ‘Save’ button in the top right corner.
Custom exploration report that includes landing pages and bounce rate
Here’s how to add bounce rate to a Google Analytics 4 exploration report:
- Open the landing page report that we created in the Landing page report in Google Analytics 4 article.
- Go to the settings and scroll down to the metrics section in the variables column.
- Click on the plus sign and search for “bounce rate”.
- Make sure it’s checked (if it’s already added, it will be checked).
- Click on “Import” in the top right corner.
- In the right column of the configurations settings, under the tab settings, scroll down to the values section.
- Grab your bounce rate from the metrics section and drag it over to the values.
- Your table will update accordingly.
How do I find exit pages in Google Analytics 4?
Currently, exit pages data in GA4 is not available from the standard reports.
To discover the webpages from which your website users leave, you need to use explorations in GA4, which are custom reports enabling the combination of different dimensions and metrics.
To create an exploration report for exit pages, follow these steps:
- To begin, sign in to your GA4 account and click on ‘Explore‘ in the left-hand sidebar.
- From the available options, select “Blank” (you can also choose “Free Form”).
- To import the desired metrics and dimensions, click on the ‘+‘ symbol next to each one.
- Choose either ‘page path and screen class’ and/or ‘page path + query string’ as dimensions. Click “Import” when you’re done.
- Next, in the ‘Select Dimensions’ window, find and import “Exits” and “Views”.
- Finally, drag-and-drop the Dimensions to Rows and the Metrics to Values. This will populate the report with data.
- Don’t forget to give your new exploration report a relevant name, such as “Exit Pages”.
I believe that now you know everything about Bounce Rate in Google Analytics 4 (GA4). If you have any questions, please don’t hesitate to ask me in the comments below.
Want to hear more from Omi about GA4? Check out these articles:
Omi Sido, thank you for sharing such an amazing article on Bounce rate in Google Analytics 4! Your clear explanations and practical tips have truly enlightened me. The appealing visuals made it even more enjoyable to read. I will highly recommend your article to anyone eager to enhance user engagement and drive business growth. Great job!
Hey Petar, thank you so much for your thoughtful feedback! I’m absolutely delighted to hear that you’ve enjoyed my article on Bounce Rate in Google Analytics 4. Trust me it is truly rewarding to know that the explanations, tips, and examples provided resonated with you. My sincere hope is that the insights shared in the article will assist you in enhancing the user engagement on your websites and achieving your business objectives. If you ever have any more questions or need further help or information, please don’t hesitate to reach out. I wish you ongoing success in all your digital endeavours!