
Recently Google announced a new version of Analytics called Google Analytics 4 (GA4) which now comes as the default option when we try to set up a new property. GA4 is an entirely new system that is not connected in any way to Universal Analytics and you can look at it as an expansion and rebranding of the App + Web property.
If you ever had a glimpse on GA4, you probably don’t really recognise anything – while this new version of GA is going to bring some great new features and a more mature tracking platform, there’s a learning curve – so in this short article, I’m going to show you how to report on your website’s landing pages in Google Analytics 4 (GA4).
Landing pages report in Universal Analytics and Google Analytics 4
If you’ve been using Google Universal Analytics for a while, then it’s easy to find your landing pages in your existing universal analytics property. Let’s head to Google Analytics and have a quick look.

Looking at a universal analytics property it is really easy to report on landing pages as we just need to:
- Click on ‘Behaviour’
- Then expand ‘Site content’
- Now click on ‘Landing pages’
This lets us report on the first pages our visitors view in each session. It’s as simple as that.
But there is nothing like a ‘landing pages’ report in the new Google Analytics 4 property so how do we know the first pages people view when landing on our website?
Let’s have a look at my Demo GA 4 property. As usual, I am using the Google Demo account – a fully functional Google Analytics 4 account that is accessible to anybody who is already using Google Analytics.
If you have previously used the public Google Demo Account, now you also get access to the Google Merchandise Store properties for GA4 within that same account.
Start by selecting ‘Engagement’. The engagement reports, let us understand what people are doing on our website by events, pages, and screens. So, let’s select ‘Pages and screens’.
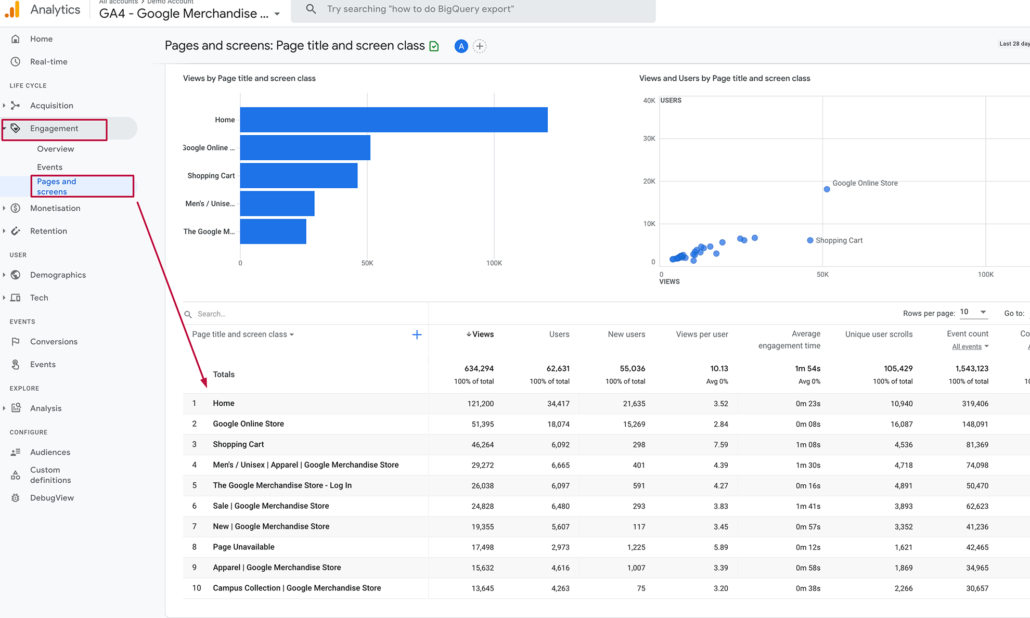
We can now see the different pages people are engaging with but we have two problems: the report shows us our pages based on page title by default and it’s also showing ‘Views’, which isn’t the same as the landing pages report we looked at previously in our Universal Analytics property.
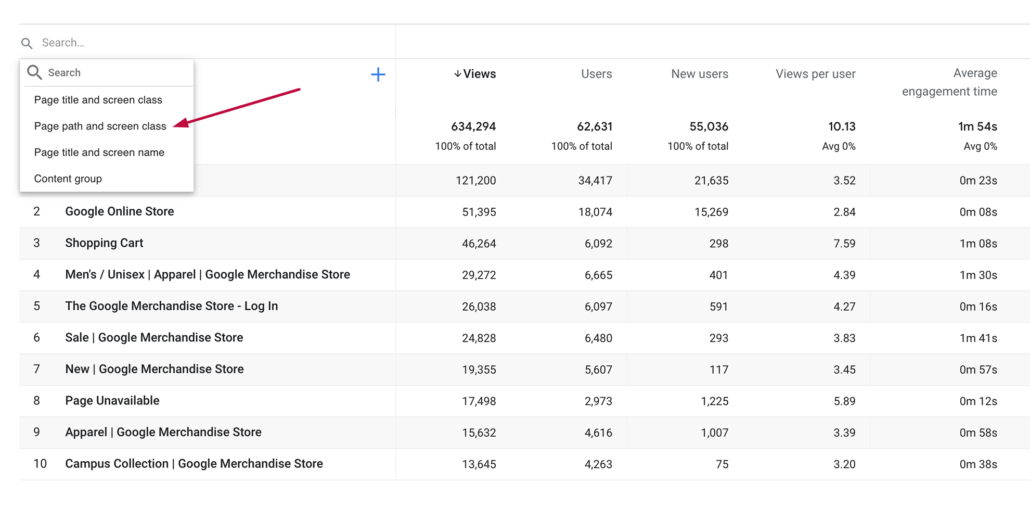
I guess most of us want to see URLs instead of Page titles so to fix that select ‘Page title and screen class’ and change this to ‘Page path and screen class’.
To change the ‘Views’ column scroll to the right and select ‘All events’ and ‘Event count’ and change this to ‘session_ start’.
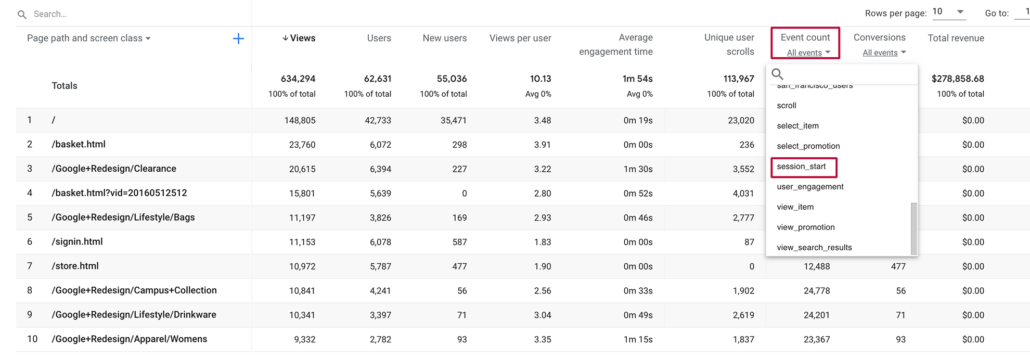
Now we are able to see the pages that people view as they start a session on our website – our landing pages.
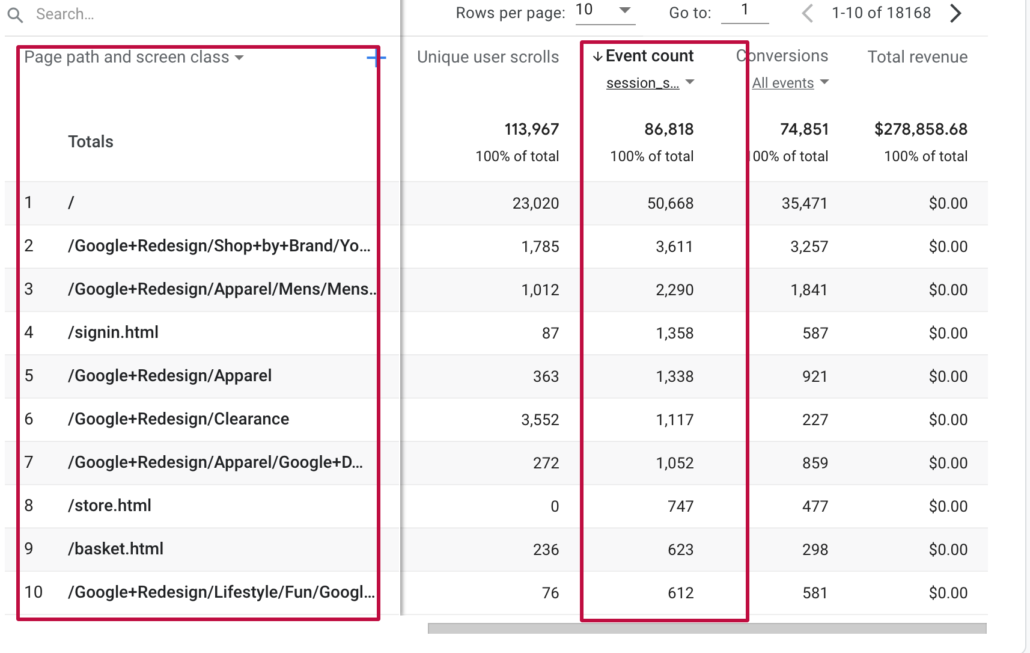
To reorder the report so top landing pages are reported first you just need to click on the heading for the column. If you want to know how your website’s traffic arrived at your site you have to change the medium.
View reports in Google Analytics 4 by Medium
- Click the ‘All users icon’ at the top of the page
- In the ‘Build comparison’ box on the thee right select ‘User medium’ as a dimension.
- Select ‘organic’ as a dimention value. Now hit ‘Ok’ and ‘Apply’.
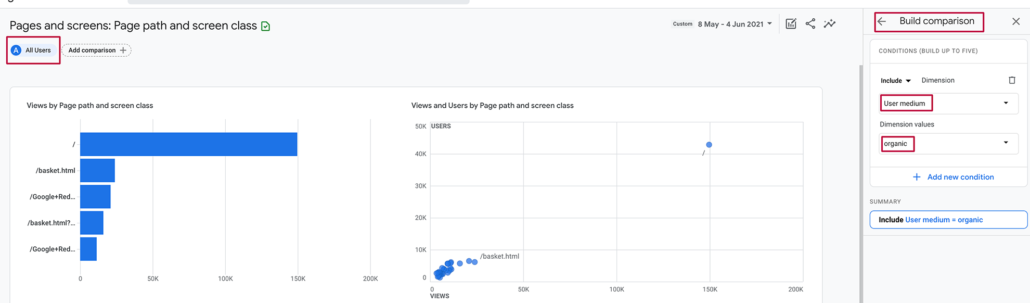
Voila, we have our landing pages report, we can see the URLs, we can see our top landing pages first and we can also change the medium.
But we still have a slight problem. Every time we open our Analytics we have to repeat the steps above and in our Universal Analytics, this report was permanent. Plus I really don’t like the scrolling left and right.
It’s time to create our own landing pages report in Google Analytics 4.
Landing pages report in Google Analytics 4
In the previous version of Google Analytics, we had the option to create custom reports under the “Customisation’ menu option. In GA4 the custom report is replaced by the ‘Exploration report’ representing the data in a dynamic table layout.
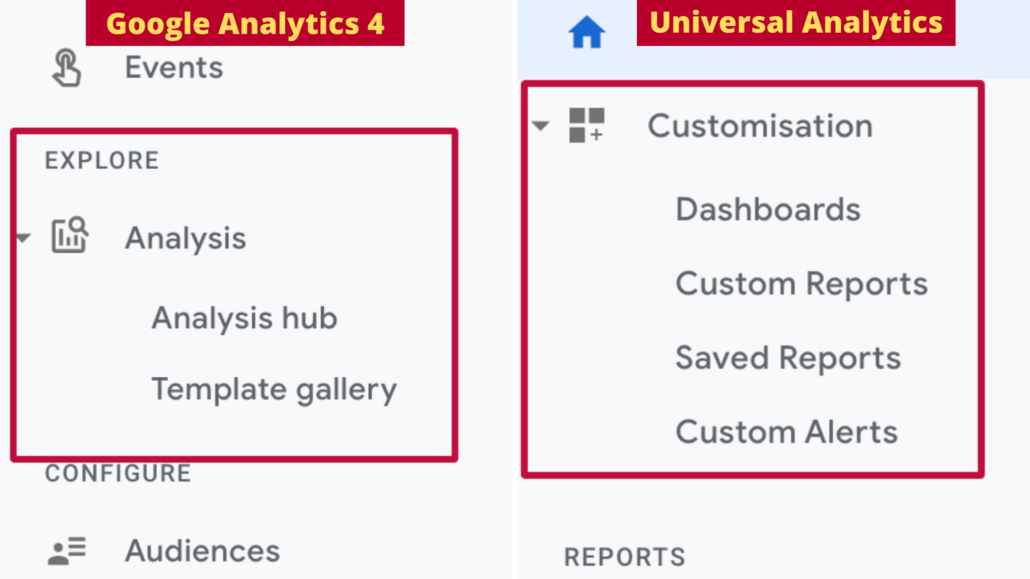
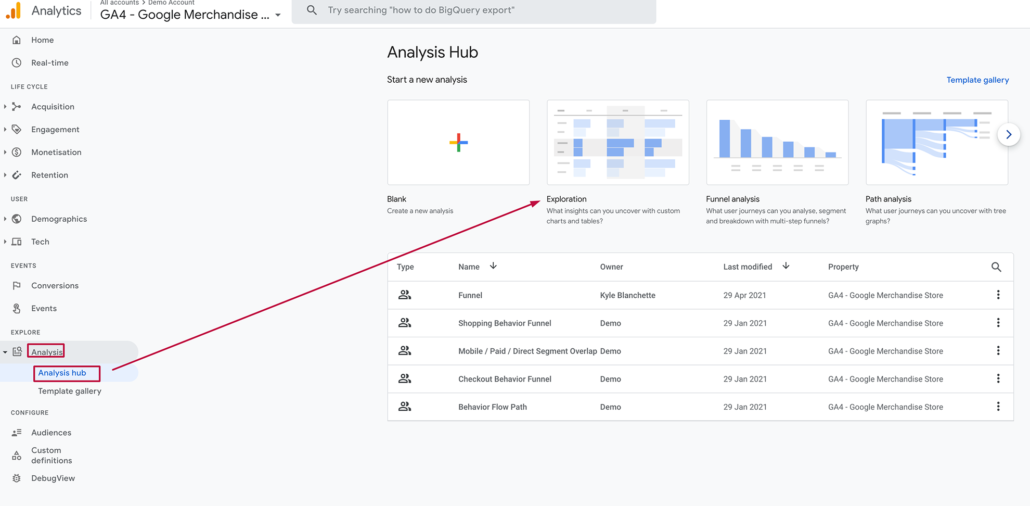
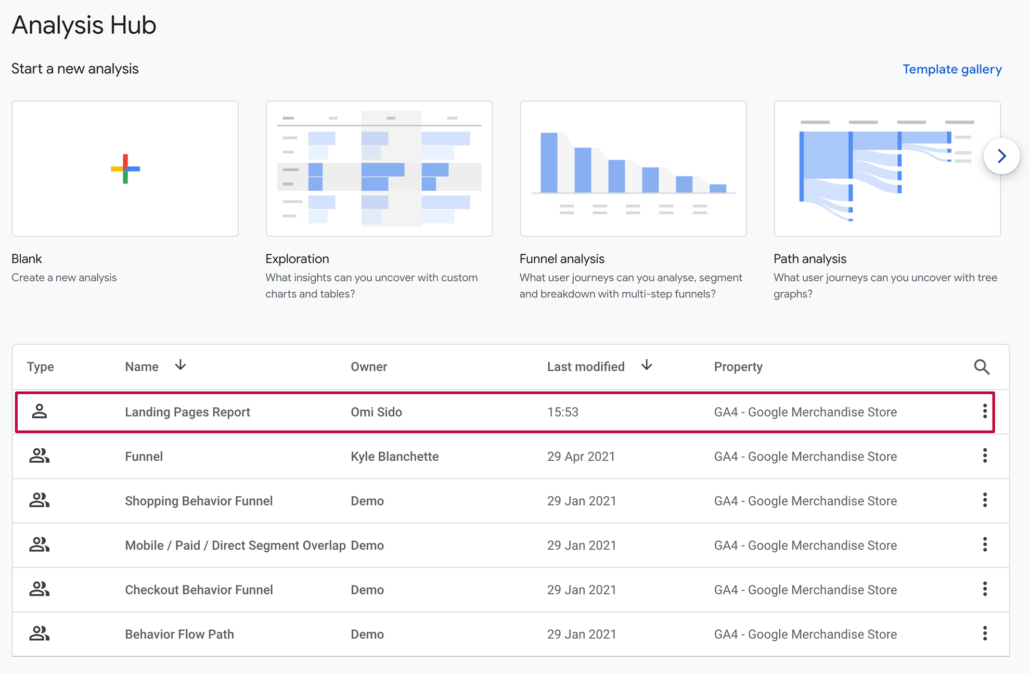
To start building a ‘custom report’ in GA4 navigate to the ‘Analysis’ drop-down menu and then click ‘Analysis hub’. You will see various analysis templates so start by selecting the option to create an exploration report.
I hope you recognise most of the elements you see there so start by clicking the plus sign next to ‘Dimensions’ and enable the ‘Page path + query string’ dimension. Then replace the existing (Town/City) row with the ‘Page path + query string’ dimension.
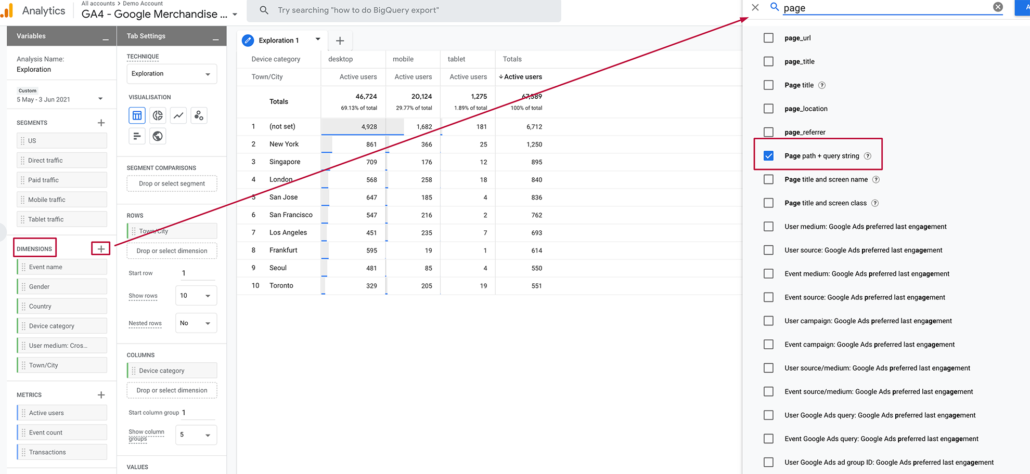
Now, let’s remove the device category from ‘Columns’ and add the ‘Session’ metric (the session_start event is triggered). Click the plus sign next to metrics, find and enable the ‘Sessions metric’ and add it to your report.
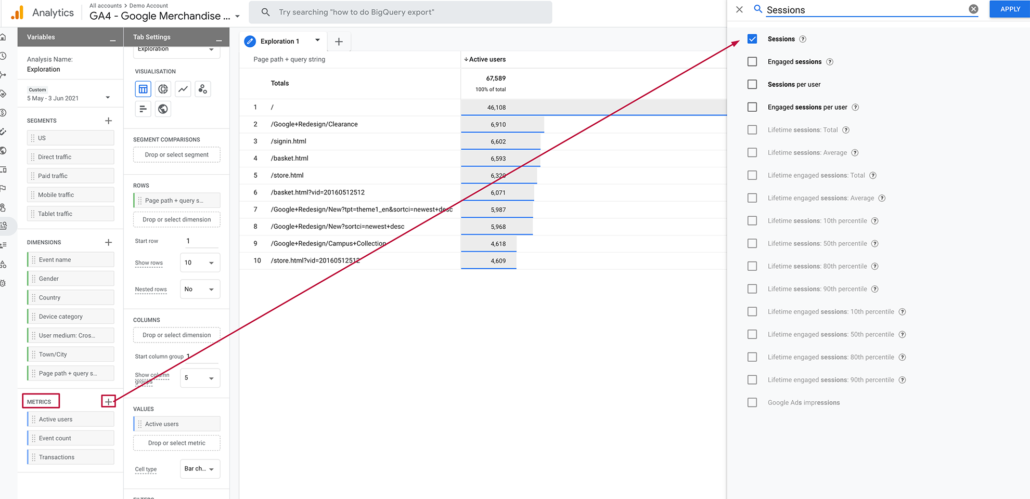
(Is it me or this feels so much like Google Data Studio?)
You can now see your top landing pages and of course, if you like, you could customise this report further by including additional metrics like new users, engagement rate, conversions and so on.
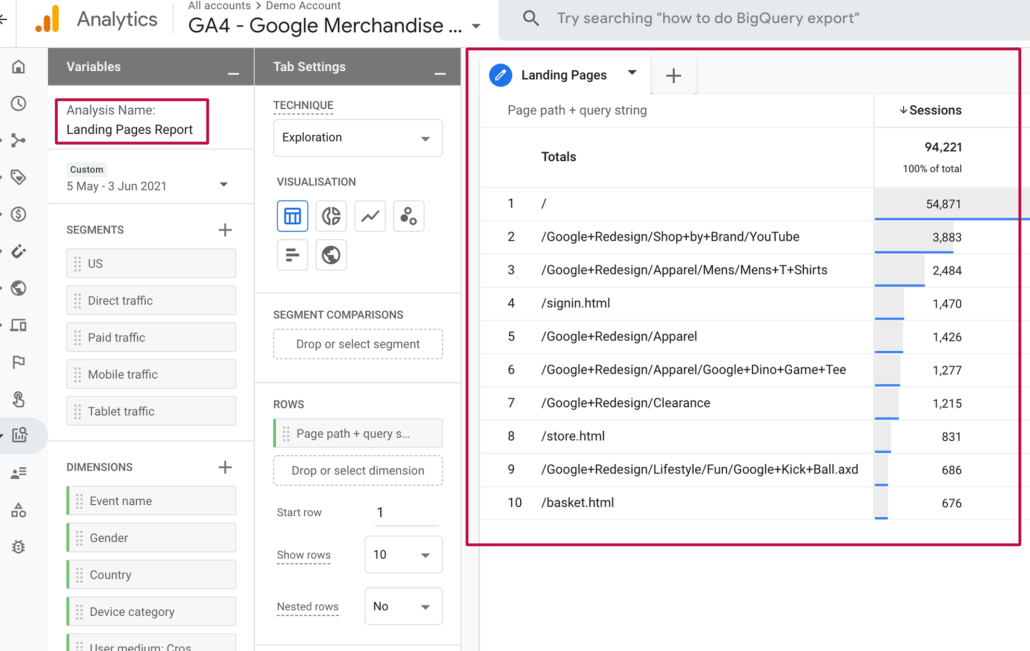
To reorder the report so top landing pages are reported first you just need to click on the heading for the column.
Don’t forget to give this report a recognisable name – in this case ‘Landing pages’ – and you are good to go. From now on every time you click on the ‘Analysis hub’ you will see your Landing Pages report.
So that’s how you can report on the landing pages for your website in GA4. Remember, you have the option of modifying the standard pages report or you can create your own landing pages report in the analysis hub.
Note: You will find that some of the metrics in your Google Analytics 4 property are different when comparing your Universal Analytics property. This is because of the different data models used between GA4 properties and Universal Analytics.
Previously Google Analytics was focusing on tracking pageviews whether the new model is trying to create a single tracking system that works across all platforms (web and mobile) and to do that GA4 relies on even-based tracking. Without going into details this means that Google Analytics 4 is getting all the data as an event, which is much more versatile than a pageview.
Have you checked how your landing pages are performing in Google Analytics 4? I’d love to know. Let me know in the comments below.

Wow, this is gold. You are a star, Omi! You inspired me to install and familiarise myself with Google Analytics 4 this weekend.
One thing I want to say is that I see Google Analytics 4 as the future of data analytics in digital marketing. The best part about this upgrade is that it allows us to start with this new tool and collect data effectively with new features and yet keep our data from our previous account intact. Genius – thank you Google.
Marketers should rush to upgrade their accounts and leverage the maximum benefit from GA4.
Hi Omi,
I am just touching base with GA4. I was looking for this exact report. I am only wondering whether the exploration report really shows the landing page views or instead just sessions that included the relevant page. Session doesn’t seem to be the same thing as the session_start event. I just compared the Pages and screens report with the column Event count (filtered by session_start) to the custom exploration report. The metrics are different. Unfortunately I don’t find the session_start option in this exploration report. Any ideas?
Cheers
Florian
Thanks for this! Is there an easy to way to see source/medium with landing page as a secondary dimension without creating a custom report? Before it was literally three clicks to get to that, and now I can’t even figure out how to begin to do that without creating a custom report. I feel like all the data I’ve relied on with UA for so many years is so much harder to find in G4.
Great article. That is very insightful, Many thanks