Funnel exploration reports in Google Analytics 4 (GA4) are a powerful tool that can help us understand how users interact with our websites or apps.
By utilising these reports effectively, we can effectively identify where our visitors are dropping off in our conversion process. As digital marketers, this information empowers us to make data-informed changes in order to improve the user experience and hopefully end up with a better conversion rate.
I am glad to say that GA4 has introduced significant improvements to funnel reports compared to Universal Analytics. These reports allow you to build insightful reports using historical data and create multiple funnel analyses. While I have to admit that Funnel exploration reports are still not perfect in GA4, I must acknowledge that they have made significant strides.
In this article, my aim is to demonstrate the effortless process of constructing Funnel exploration reports in Google Analytics 4. As always, I will use simple examples to walk you through the process, and per usual, I will provide you with some tips for getting the most out of your GA4 Funnel exploration reports. I know you came here to learn so let’s get started.
Create a funnel in GA4 Explorations
To begin, log in to your Google Analytics 4 property, select “Explorer” from the left sidebar and then click on Funnel exploration.
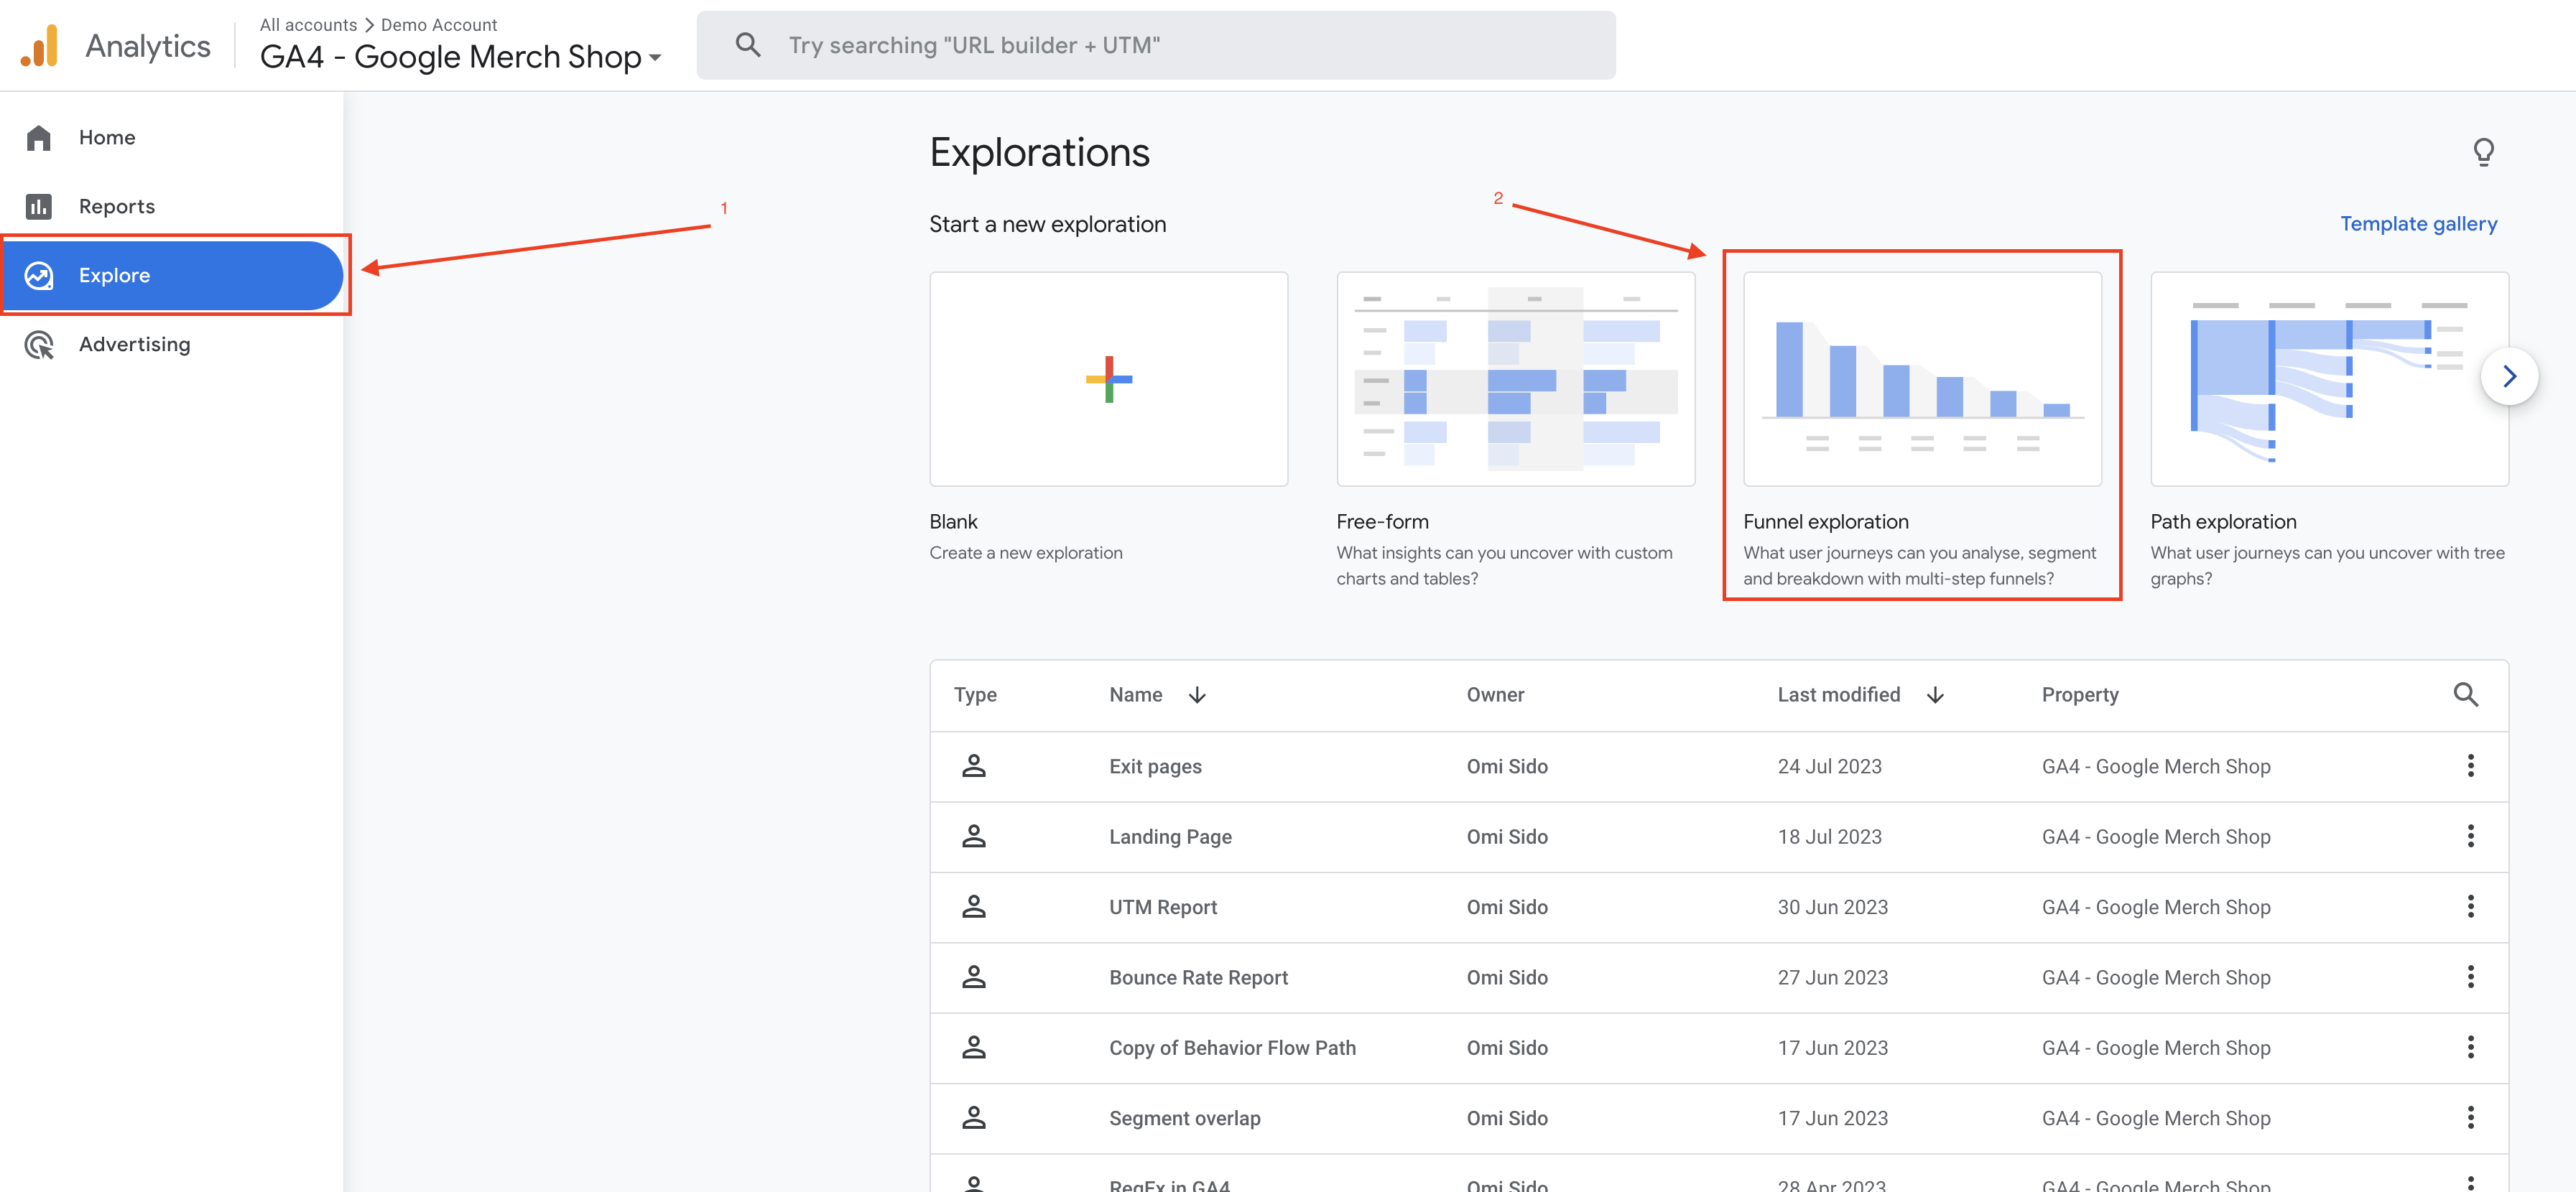
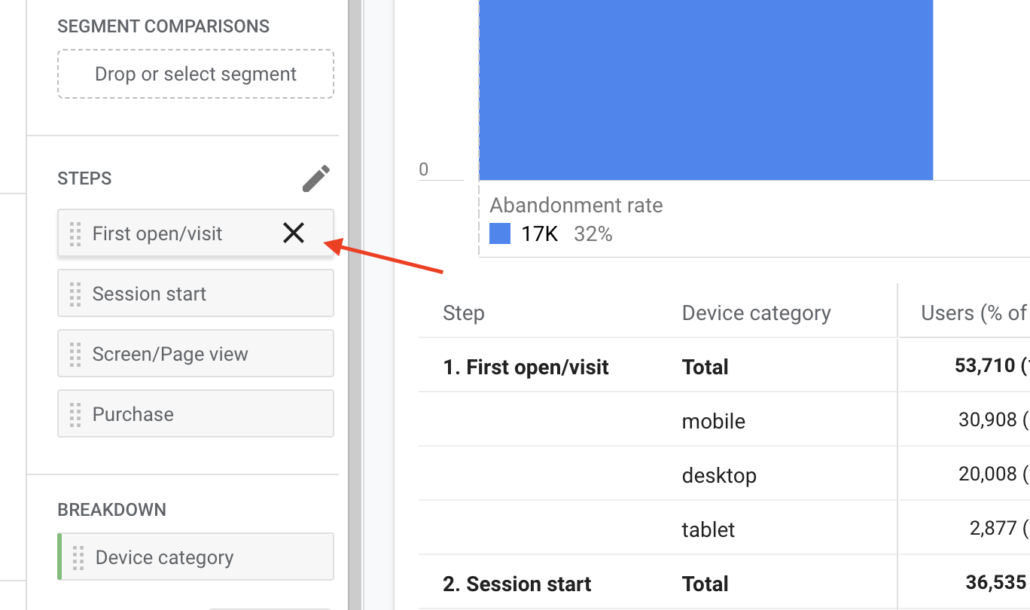
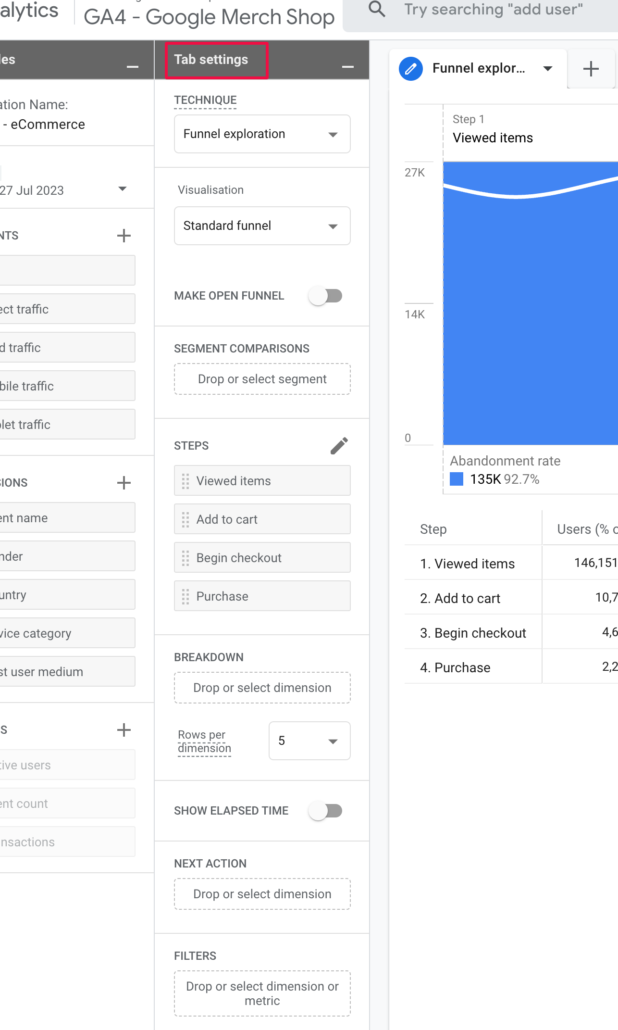
The interface consists of three columns: ‘Variables’, ‘Tab Settings’, and the output report section. In the ‘Variables’ column, you can control the dimensions, segments, and metrics you wish to include. The ‘Tab Settings’ column allows you to customise the report’s appearance and settings. The largest section is the output report area (called Funnel exploration), which displays the generated report based on your tab settings.
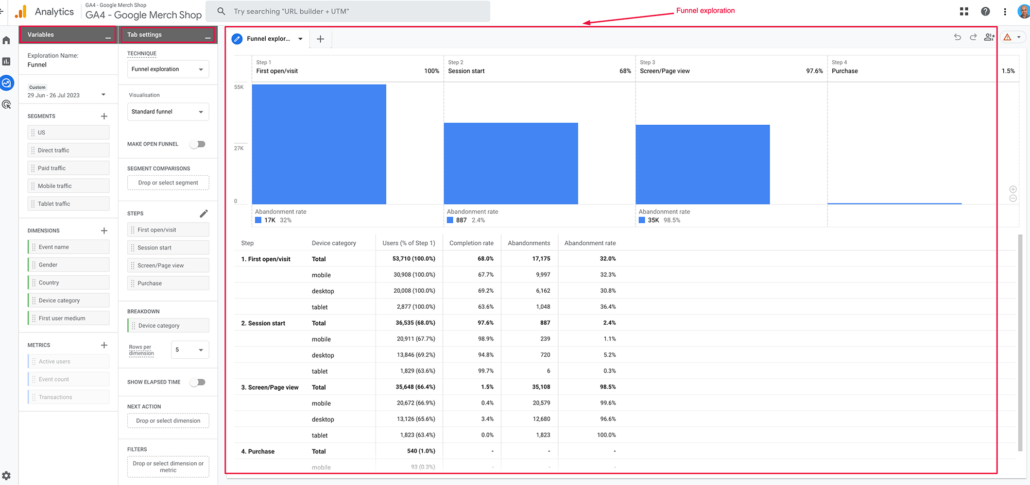
By default, Google Analytics 4 includes a predefined funnel in the report, but we’ll start from scratch. Remove all the steps by clicking the “x” icon next to each step.
To better understand funnel exploration, let’s walk through an example. In fact, the best way to understand ‘Funnel exploration in GA4 is to build your own Funnel exploration report from scratch.
For this example, let’s create a funnel with the following steps (a funnel is a series of steps that users must take in order to complete a conversion):
- View a product
- Add a product to the cart
- Begin Checkout
- Purchase
For each step, we need to specify a condition. A funnel condition is a rule that determines whether a website visitor has completed a particular step. In our example, the conditions are:
- View a product – the website visitor has viewed a product page.
- Add a product to the cart – the user has added a product to their cart.
- Begin checkout – the user has started the checkout process.
- Purchase: The user has completed the checkout process and purchased a product.
Building and analysing your Funnel Exploration report in GA4
To configure the steps of our funnel, we need to click on the pencil icon in the steps section, which will open the ‘Edit funnel steps’ section.
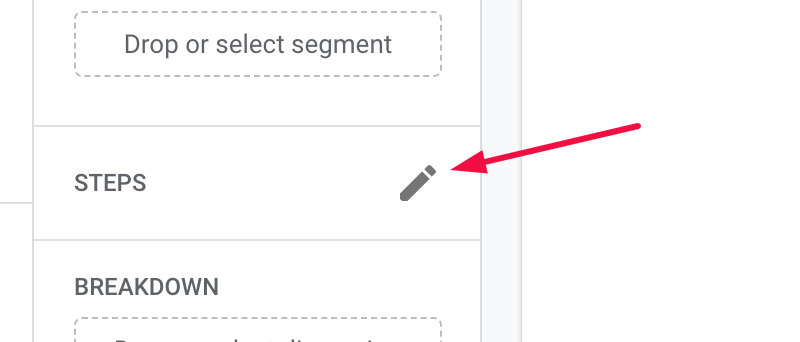
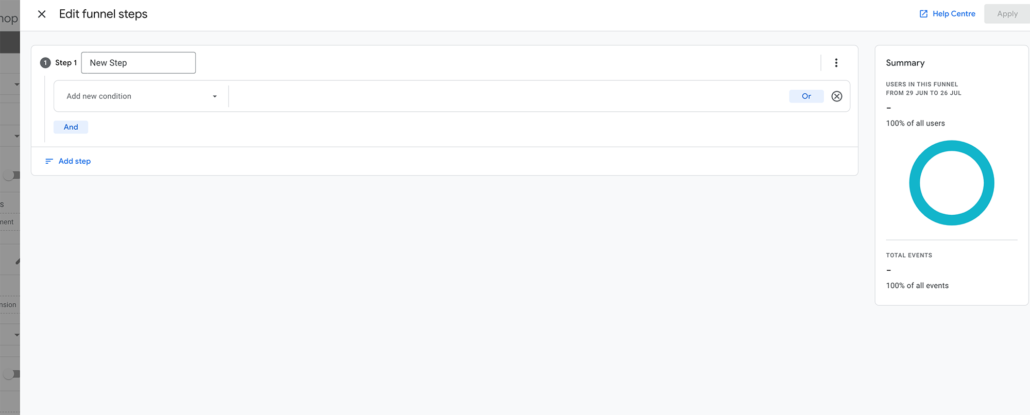
Here in the ‘Edit funnel steps’ section, we can configure our funnel steps, which will be available later on in our report.
For this example, I am using the Google [GA4] Demo account – a fully functional Google Analytics account that is free to use (and abuse), and that account already has some e-commerce GA4 recommended events like add_to_cart, view_item, begin_checkout, and purchase. If you haven’t set up e-commerce tracking in your GA4 property, you will not be able to see these events, as you need to specifically send these events to Google Analytics with these exact names!
If you don’t know what events are in GA4, please read my The Complete Guide to Events in Google Analytics 4 article and I would strongly recommend including your developers in the process.
Step 1: Adding the first funnel step
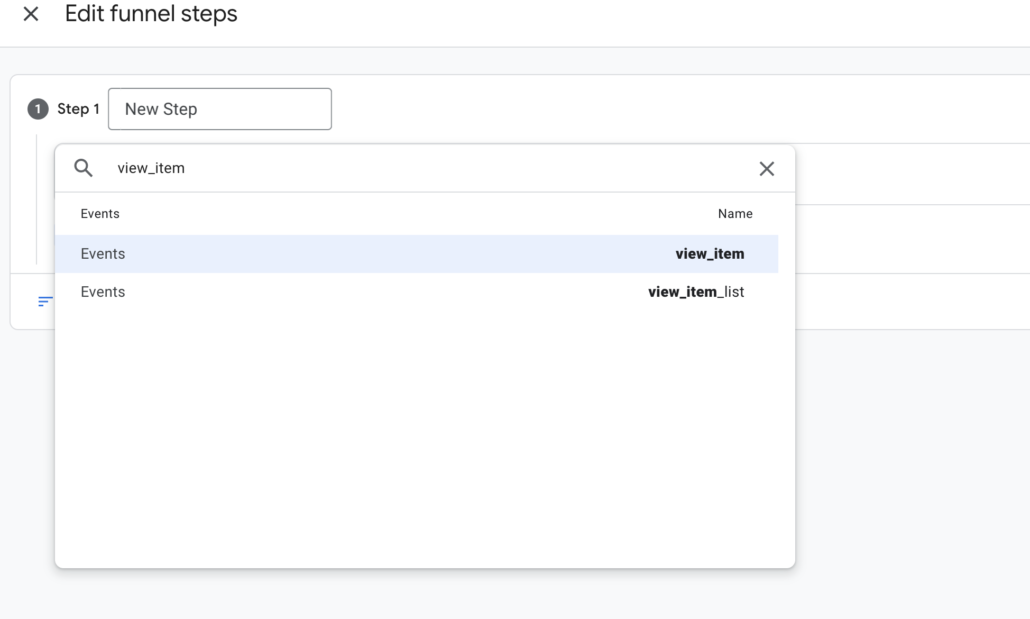
Let’s start building our funnel by adding the first step. As we agreed earlier, the first step will be showing people who viewed an item, and for this, we need to find and add the event view_item (click on Add new condition which will open a search bar) .
As I said earlier, if you want to collect this data, you have to send an event with this specific name to your Google Analytics 4 property that will have parameters like product name, product ID, price, quantity, etc.
Example:
gtag("event", "view_item", {
  currency: "USD",
  value: 12.99,
  items: [
    {
      item_id: "SKU_67890",
      item_name: "Omi Hoodie",
      affiliation: "Omi Store",
      coupon: "FALL_SALE",
      discount: 3.00,
      index: 0,
      item_brand: "Omi Store",
      item_category: "Apparel",
      item_category2: "Adult",
      item_category3: "Hoodies",
      item_category4: "Pullover",
      item_category5: "Long sleeve",
      item_list_id: "related_products",
      item_list_name: "Related Products",
      item_variant: "black",
      location_id: "ChIJR0lV3V5ZwokR-sOXDvTQd-Q",
      price: 15.99,
      quantity: 1
    }
  ]
});
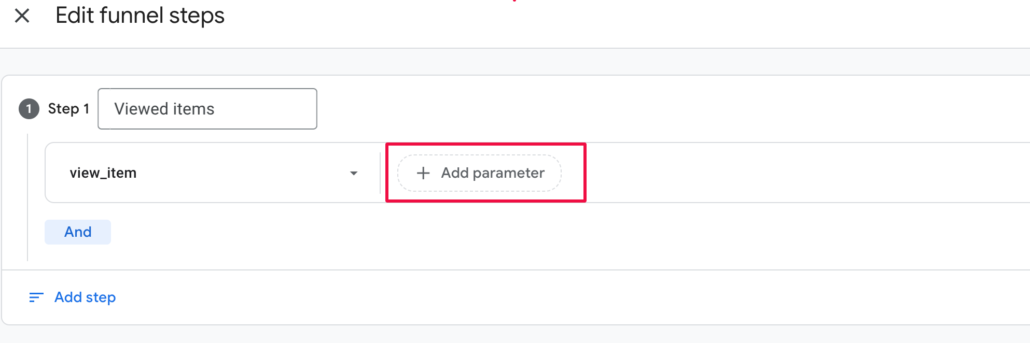
After finding the right event for the funnel step, you should always give it a distinctive/recognisable name as that will later show in the Funnel report. In this case, I have chosen ‘Viewed items’ and now that I’ve completed the first step of our funnel I can move to add the second one.
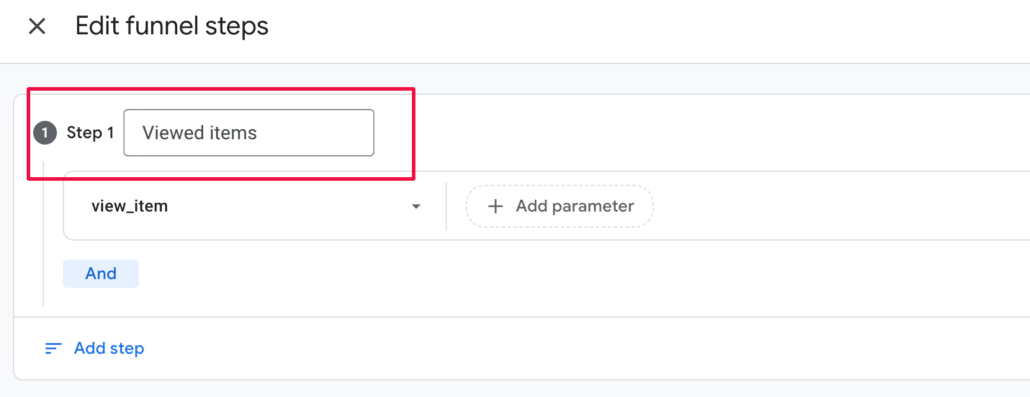
But before that, to make a funnel step more explicit, GA4 gives us the ability to by clicking on the ‘Add parameter’ plus sign.
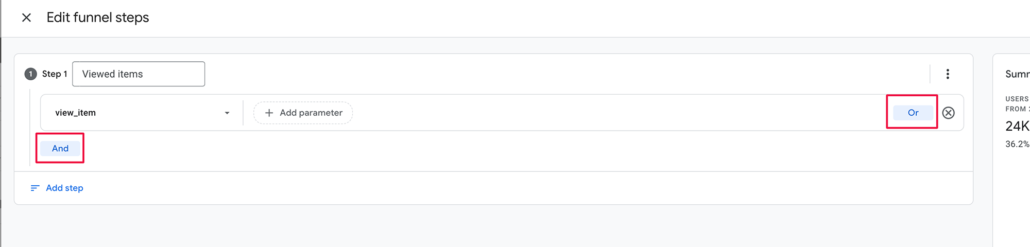
The possibilities don’t stop here and we are also allowed to add another condition to the step using the logical operators ‘And’ or ‘Or’. The operator ‘And’ means that both conditions have to be met, and in the case of ‘Or’ a visitor must complete one condition or another in order for the system to ‘move’ the site visitor to the next step.
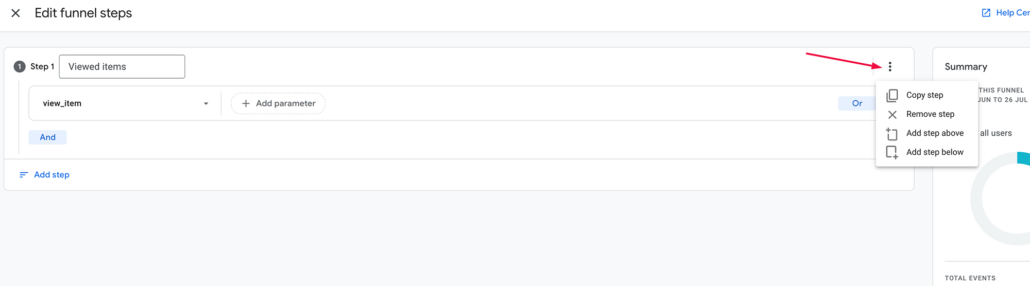
If you click on the three dots in the top right corner (on top of the Or operator and to the left of the Summary section), you can also copy or remove the step, or add a step above or below.
As I mentioned before Google is giving us a lot of options in building our custom funnels, so if you forgot something or simply feel like adding another funnel step, you can always adjust your funnel at a later date.
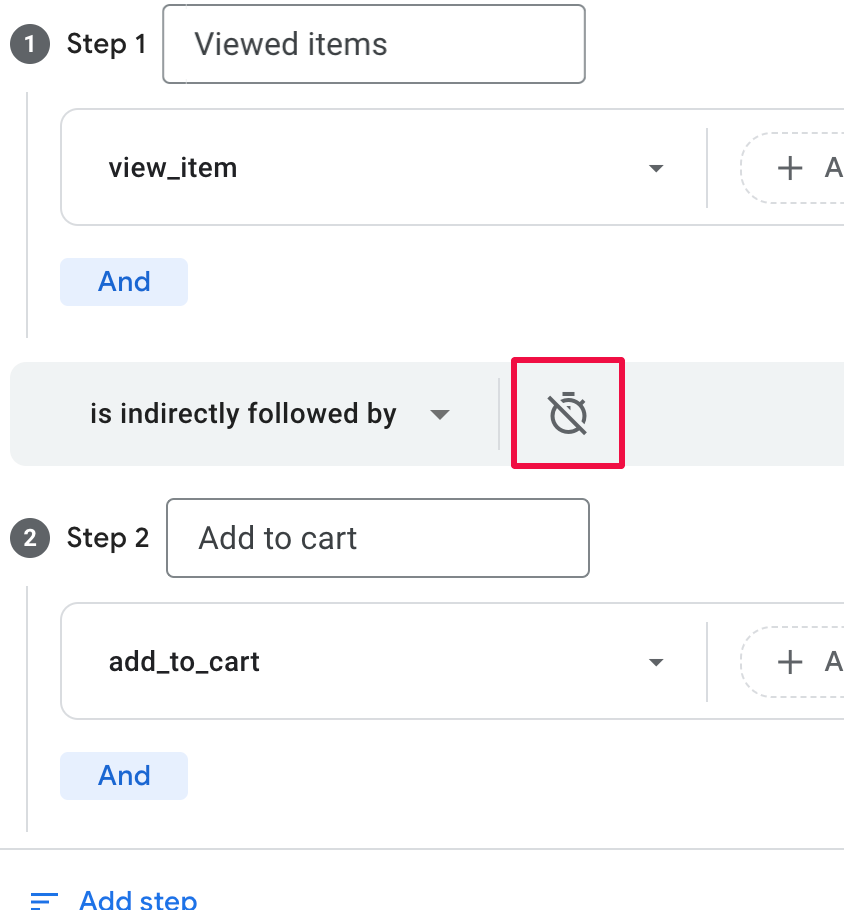
Step 2: Tracking visitors who added items to the cart
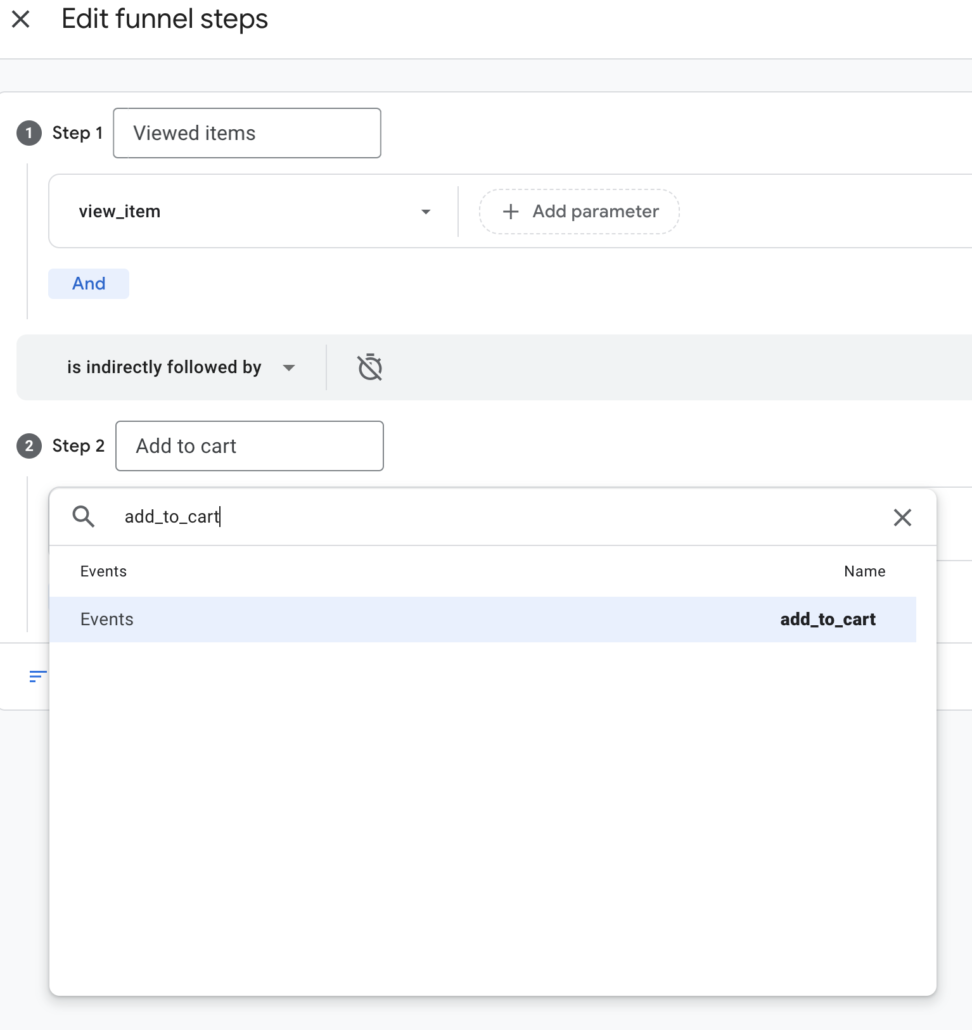
Now let’s add the second step of this funnel, where we want to track visitors who added an item to the cart. To do that, first we need to click on the ‘Add step’ button and then find and add the add_to_cart event. Then let’s label this step as ‘Add to cart’.
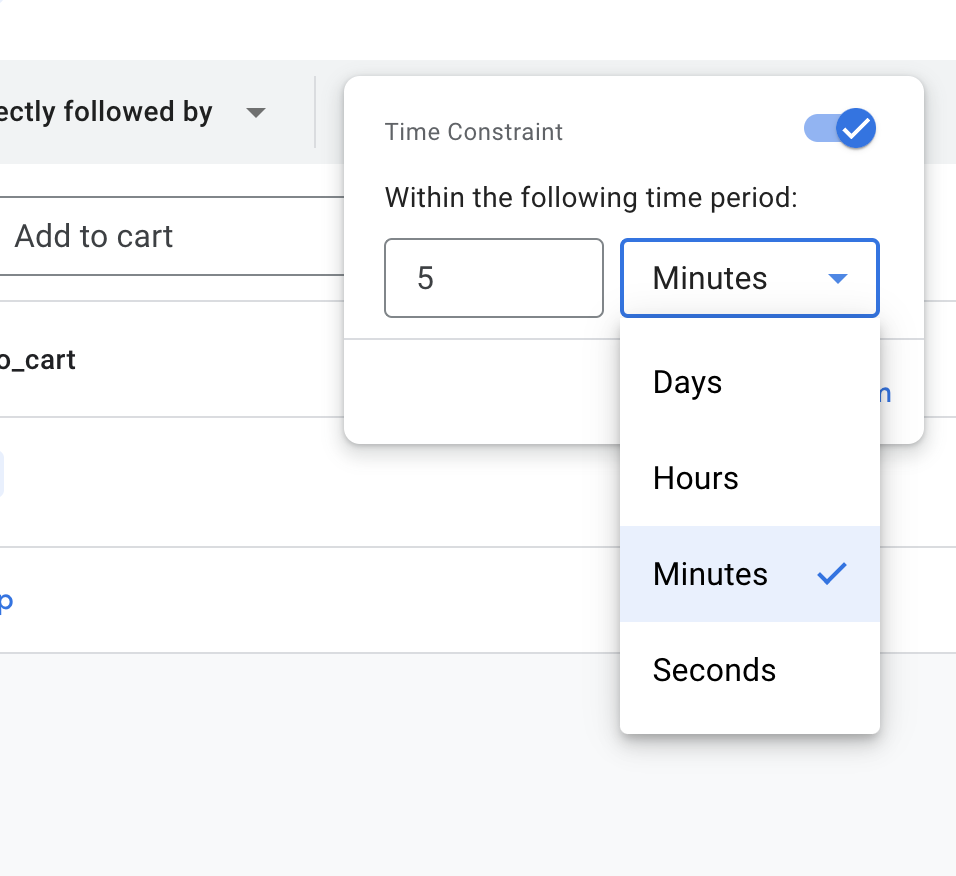
If the funnel you are building is time-sensitive, and you want to know how many visitors completed a step within a particular period of time, you should click on the clock icon and select the time constraint.
If you, for example, choose 5 min, then the difference between the first event and the second event should be 5 min or less (I hope it makes sense).
By the way, you have a choice of minutes, days, hours, and even seconds (customers adding items to the cart within seconds – is that even possible? Lol).
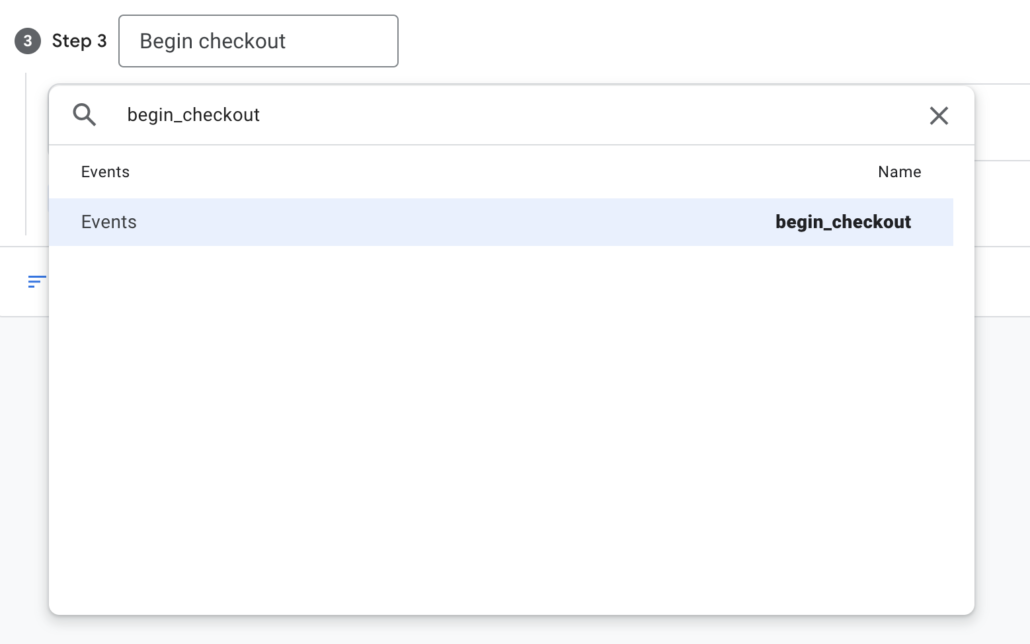
Step 3: Tracking visitors who begin the checkout process
In our third step, we want to track visitors who begin the checkout process, so we need to find and add the begin_checkout event. Let’s give this step the distinctive ‘Begin checkout’ name.
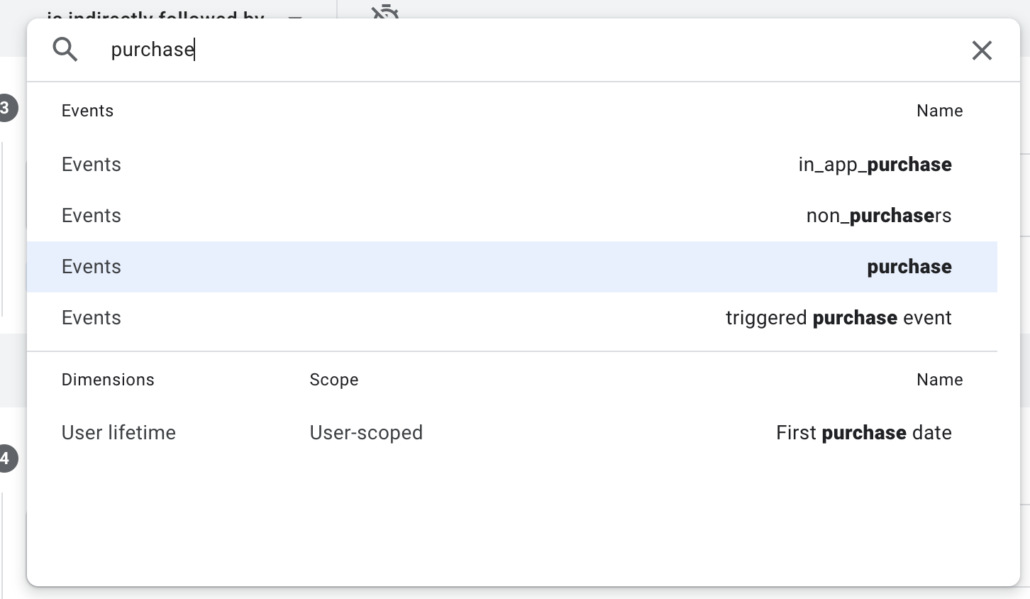
Step 4: Tracking visitors who make a purchase
The last step of our funnel is where we want to track people who purchased our products. Let’s name it “Purchase” and add the GA4 custom event called ‘purchase‘.
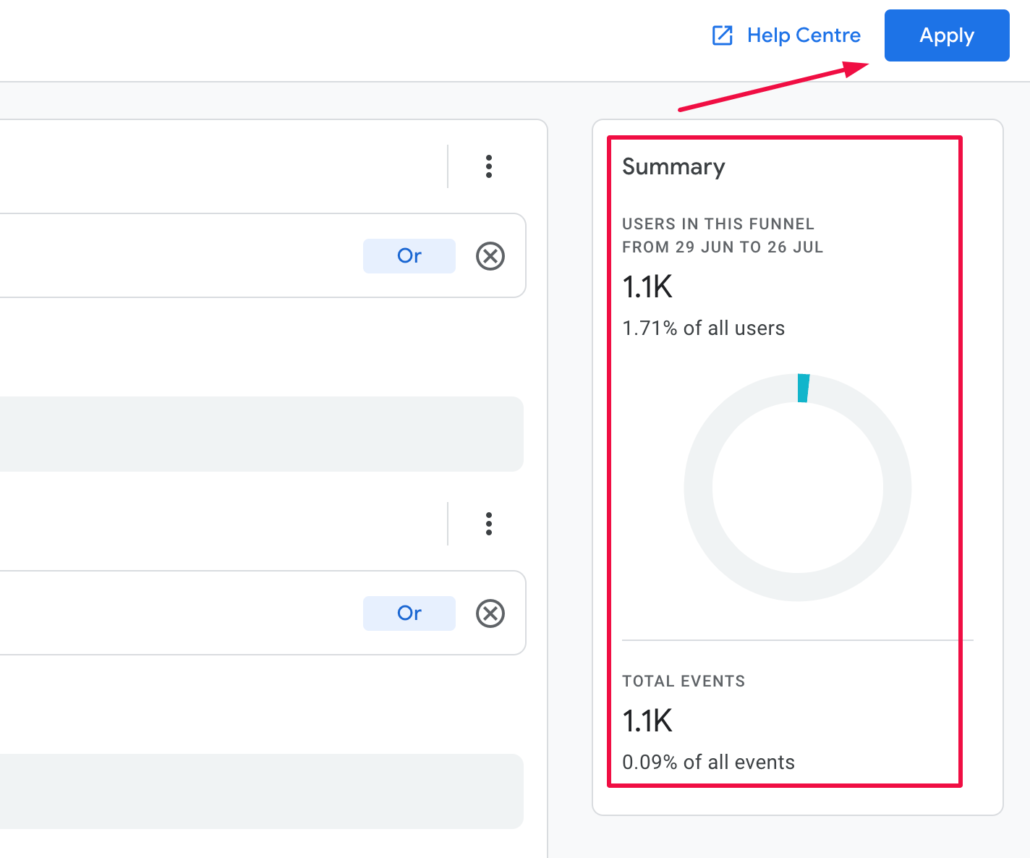
After adding the final step of the funnel, in the top right corner, you can see how many visitors are included, and if you’re satisfied, click “Apply” to add the funnel to your report.
View your Funnel exploration report
Once you’ve created a funnel, your funnel report will be available in Explorations (give it a unique name so you can distinguish it from other Funnel reports). Here, you can duplicate, rename, or delete your report.
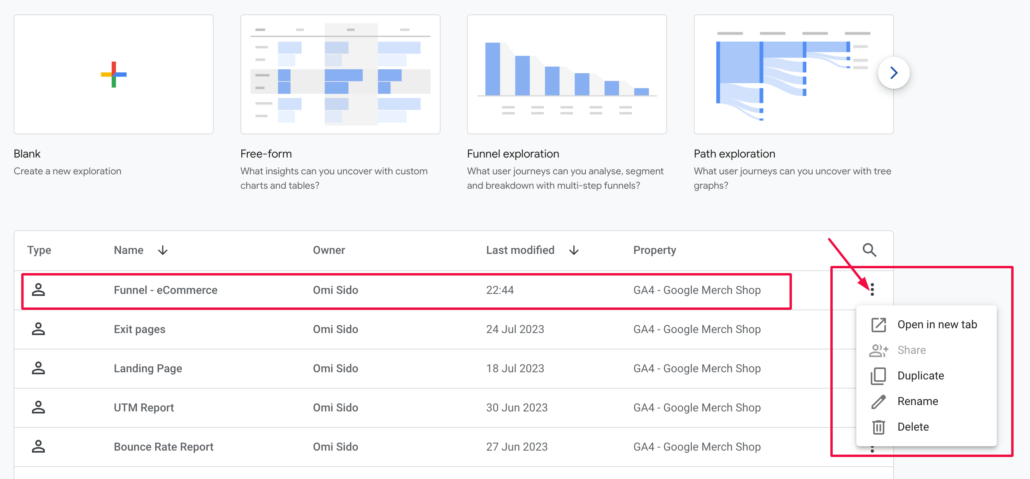
If you click on Funnel Explorations, GA4 will give you a new Funnel report with a predefined funnel that you have to start configuring from zero. Hence, most of the time, I prefer duplicating an existing Funnel report.
Analyse your GA4 Funnel exploration report
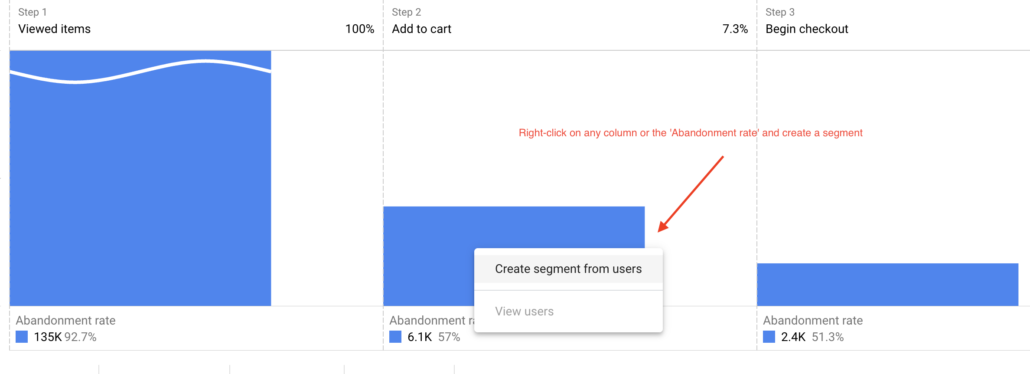
Your funnel report will show you how many users have completed each step in your funnel. It will also show you the for each step. The abandonment rate is the percentage of users who did not complete the step.
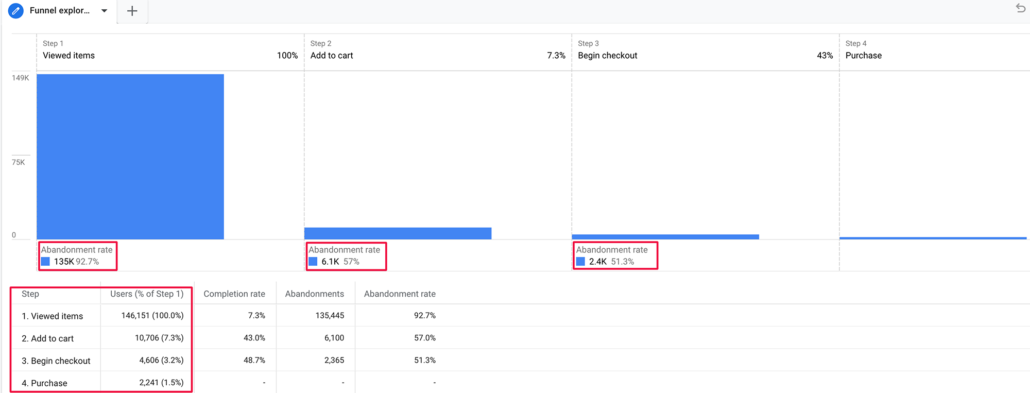
Look for steps where the abandonment rate is high. These are the steps where users are dropping off in your conversion process.
In the example above, we can see that 146,151 thousand visitors saw the products in the Google Merchandise Store. Then, 10,706 thousand visitors added a product to the shopping cart. Out of those 10,706K visitors, 4,606 started the checkout process, and finally, 2,241 thousand people purchased a product.
Once you’ve identified the steps where users are dropping off, you can start making changes to improve your user experience. For example, you could add more information to the product pages, or you could make the checkout process easier.
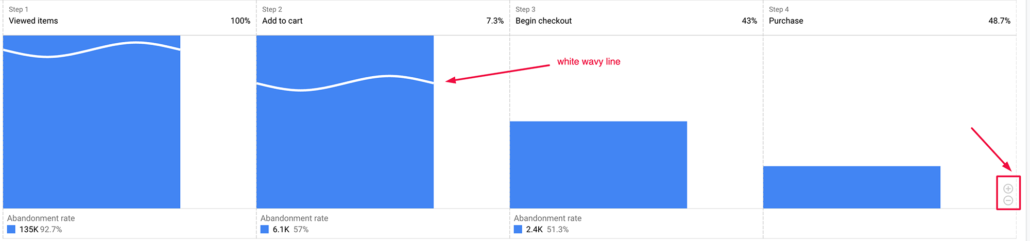
If you want to zoom in or out while interacting with the funnel, simply click on the plus and minus icons in the bottom left corner. When you zoom in, the white wavy line shows that the column is much higher and doesn’t fit into the graph.
What I love about this interactive funnel is that I can right-click on any column or the ‘Abandonment rate’ and create a segment. For example, I can create a segment from the second step of our funnel, “Add to cart” abandonments, that I can later use to create an audience, import this audience to Google Ads, and target people who added a product to the shopping basket but for whatever reason ended up not purchasing it.
Now that you have a basic understanding of how Funnel explorations work in GA4 let’s see how we can dive even deeper into our data by amending things in the ‘Tab settings’.
Funnel exploration Tab Settings
In the Funnel Tab settings, you can customise various aspects of the funnel exploration. Let’s start from top to bottom.
Funnel Visualisation
The first setting you can change in the Funnel Tab settings is ‘Visualisation’. Under ‘Visualisation’ you have the option to choose between trended funnel and standard funnel visualisation.
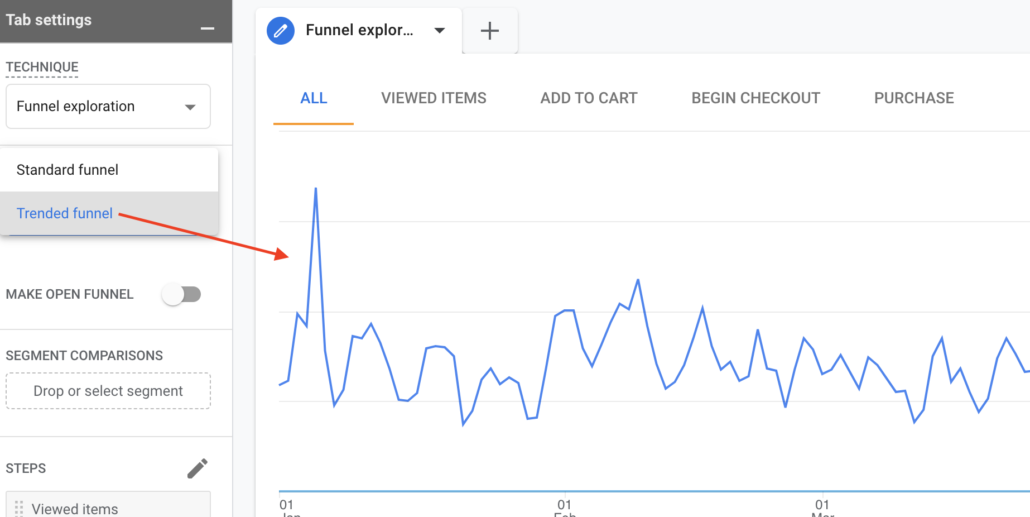
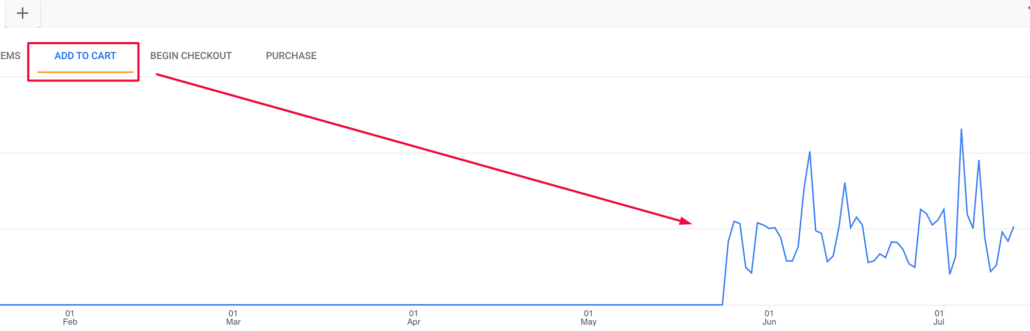
The trended funnel allows you to track changes over time, while the standard funnel provides a static view. Each line in the trended funnel represents a step and it shows us how this step changed over time. You can even isolate a funnel step by clicking on the step name and see how a step changed over a chosen time period.
Somehow I prefer the ‘Standard funnel’ but it’s always good to have options.
Open funnel vs closed funnel in GA4
By default, funnels in GA4 are closed, but we are allowed to change that by clicking on the ‘make open funnel’ toggle. An open funnel allows users to enter at any step, while a closed funnel requires users to enter at the first step. In other words, a closed funnel means that if your website visitor enters step 2 or any other step except the first one, then they won’t be counted.
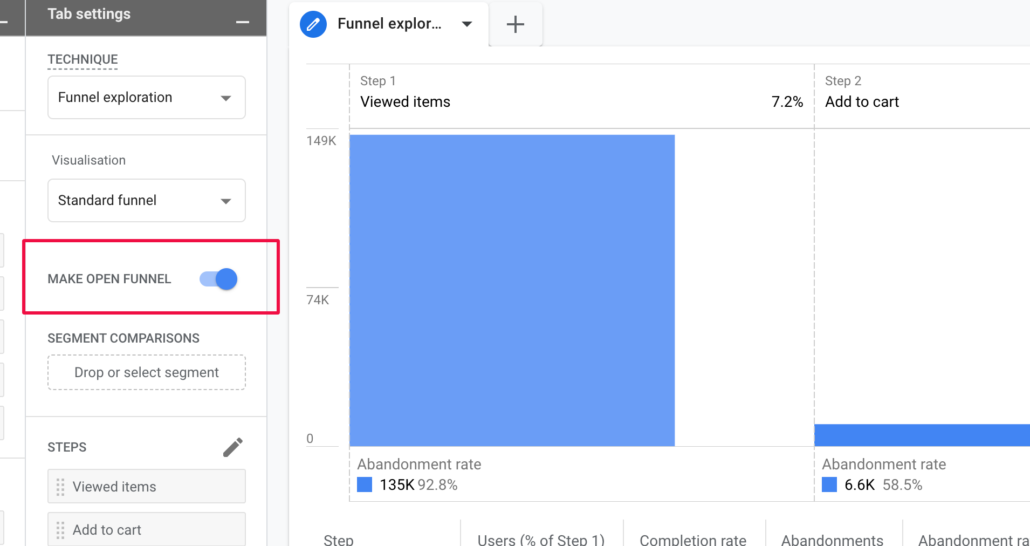
Does it make sense to have an open funnel? Well, if you have an online shop and some of your visitors land on the product page, it makes sense to have an open funnel if the first step is a category page. But even then, I prefer two separate funnels: one starting from the category page and another starting from the product page, without including category page traffic.
Segment Comparisons in Funnel Exploration
Under the ‘Segment comparisons’ section, we can compare different segments within the funnel and apply filters to focus on specific data. GA4 allows us to compare up to 4 segments that are already included in the Segments section under the Variables tab.
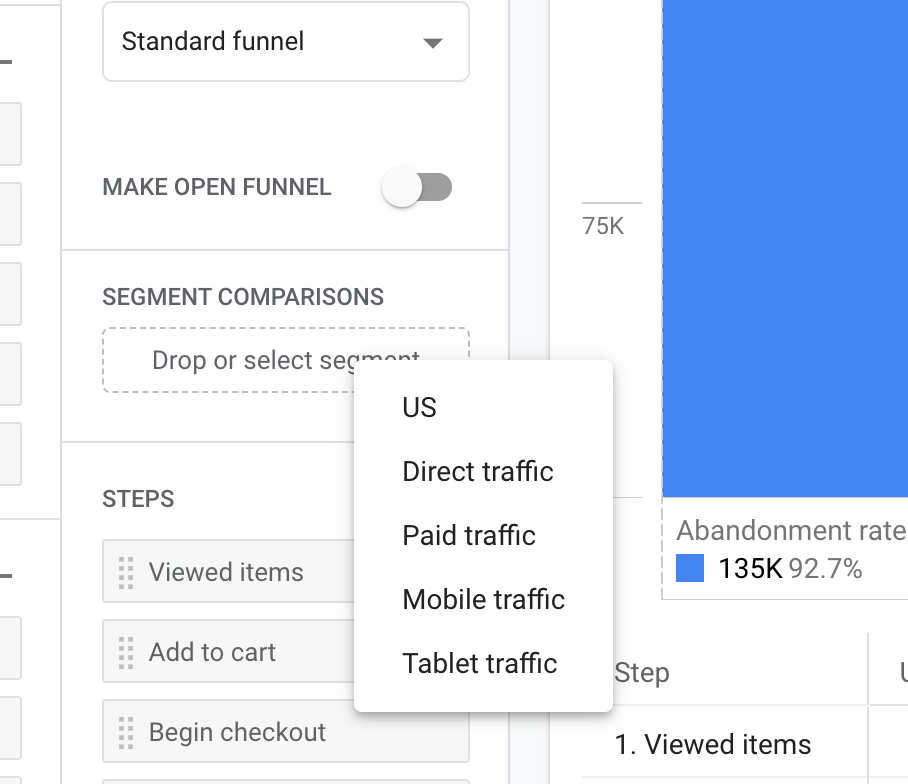
For example, if I want to compare how Direct traffic is performing against Paid traffic, all I have to do is add the two to ‘Segment comparisons’ and the system will automatically give each segment its bar (or a line if you’ve previously selected Trended Funnel) in the funnel chart.
The system will also populate the breakdown table below the chart with the nested values. As you can see from the screenshot below, a lot more people have purchased coming from direct traffic than paid.
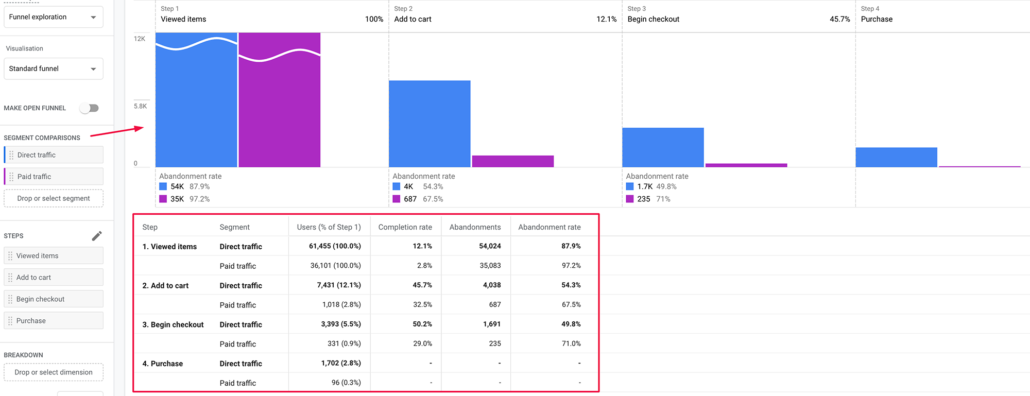
Note: As I mentioned earlier, you can right-click on any of the bars and create a segment.
Funnel Steps
I’ve already told you how to use this section, but it’s worth mentioning that after building your Funnel, you can add more steps at a later date by clicking on the pencil icon. Alternatively, you can remove a step(s) by simply clicking on the ‘x’ button. In this section, you can also reorder the steps by dragging them up or down.
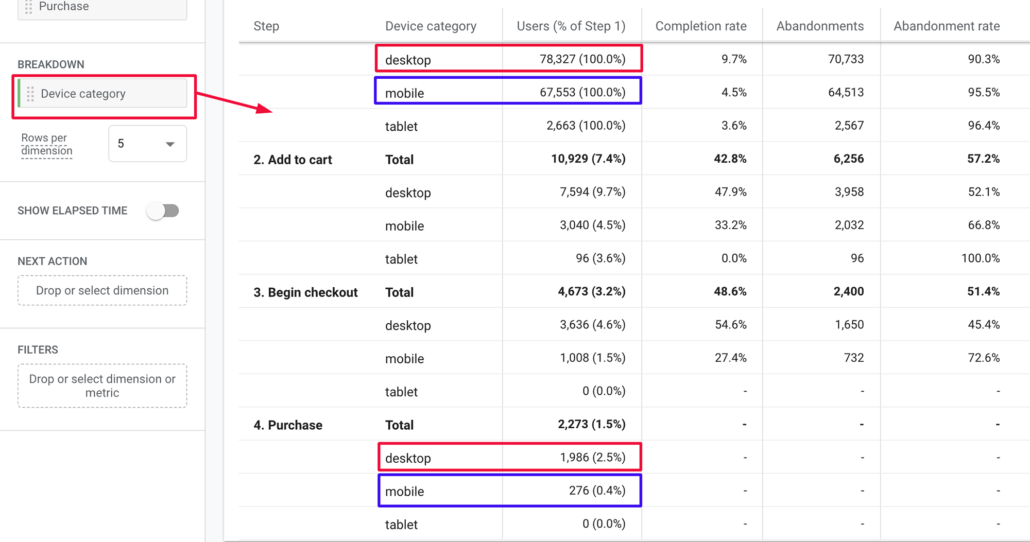
Breakdown
In this section, you can gain insights into your funnel analysis data by exploring it through a single dimension. The system provides us with the option to easily customise our Funnel report by dragging and dropping dimensions from the “Variables” section. Moreover, you have the flexibility to determine the number of rows per dimension to include in your report.
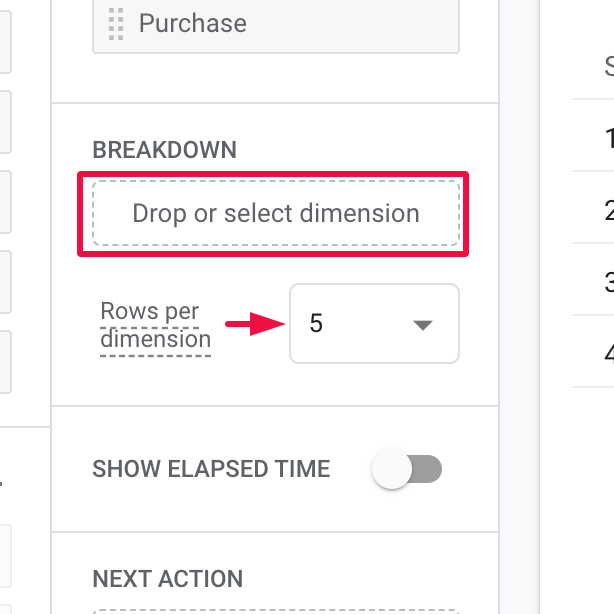
By default, this section is populated with the “Device category” dimension, and in our example (picture below), we can clearly see that although the number of people entering the first step of our funnel through mobile or desktop is almost the same, the number of people who purchased a product through desktop is nearly six times higher than the number of visitors who purchased a product using a mobile device.
Show Elapsed Time
If you’re curious about the average amount of time it takes for your users or visitors to progress from one step to the next in your funnel explorations, you can enable the “Show Elapsed Time” feature in Funnel Explorations in GA4. This feature will allow you to observe and analyse the elapsed time between each step in the funnel and gain valuable insights into the duration it typically takes for users to navigate through your funnel steps.
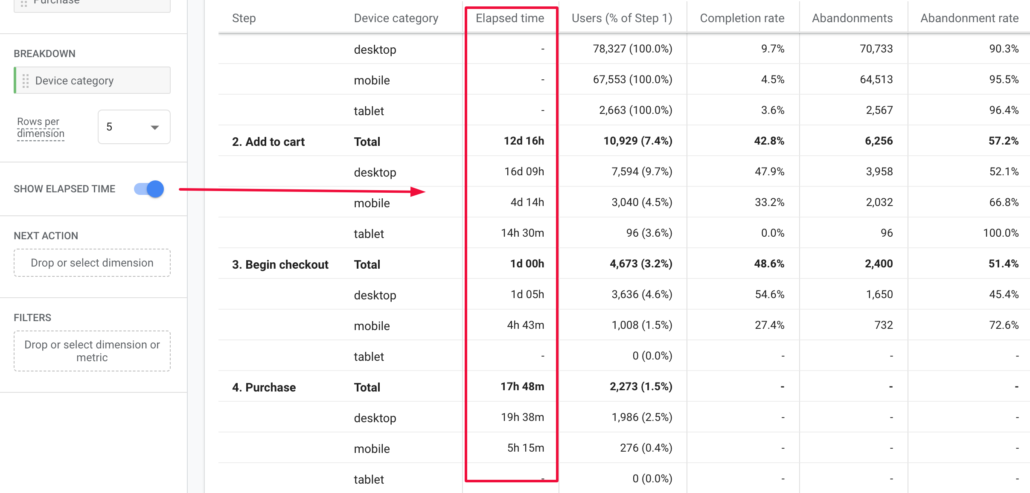
Note: I am almost 100% sure that the numbers that the system is currently showing are wrong. For example the data shown for Desktop in the Add to Cart step of 16d 09h is probably a sum of the time of all visitors rather than the average time it took for a visitor to go from step one to step two.
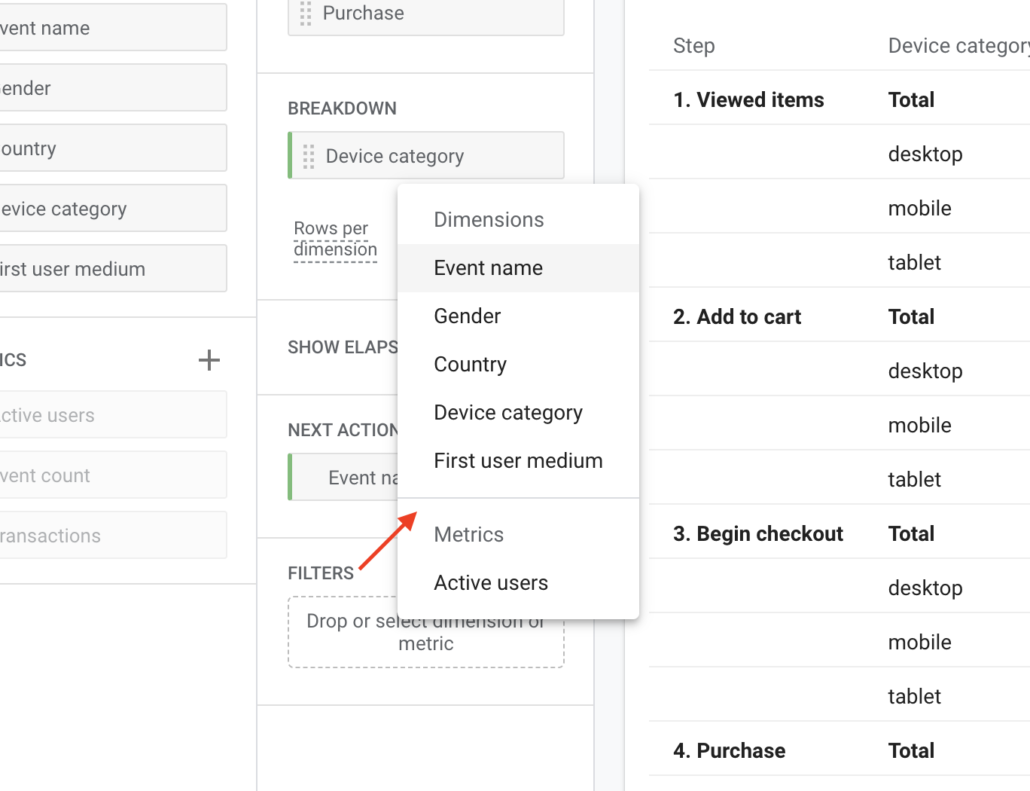
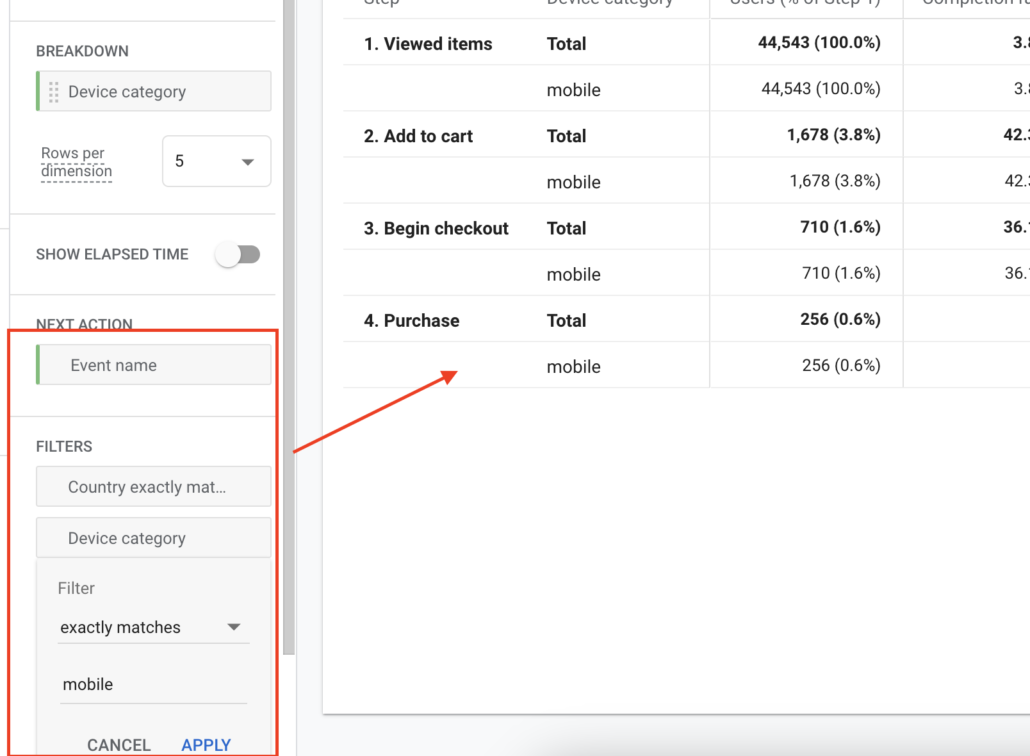
Next Action
Next Action is a very useful functionality in Funnel explorations as it allows you to analyse the subsequent actions taken by users after completing a specific step in your funnel. For example, if you drag the ‘Event Name’ dimension over you can hover anywhere on your Funnel report and it will show you the next 5 most popular events that your visitors did immediately after this step.
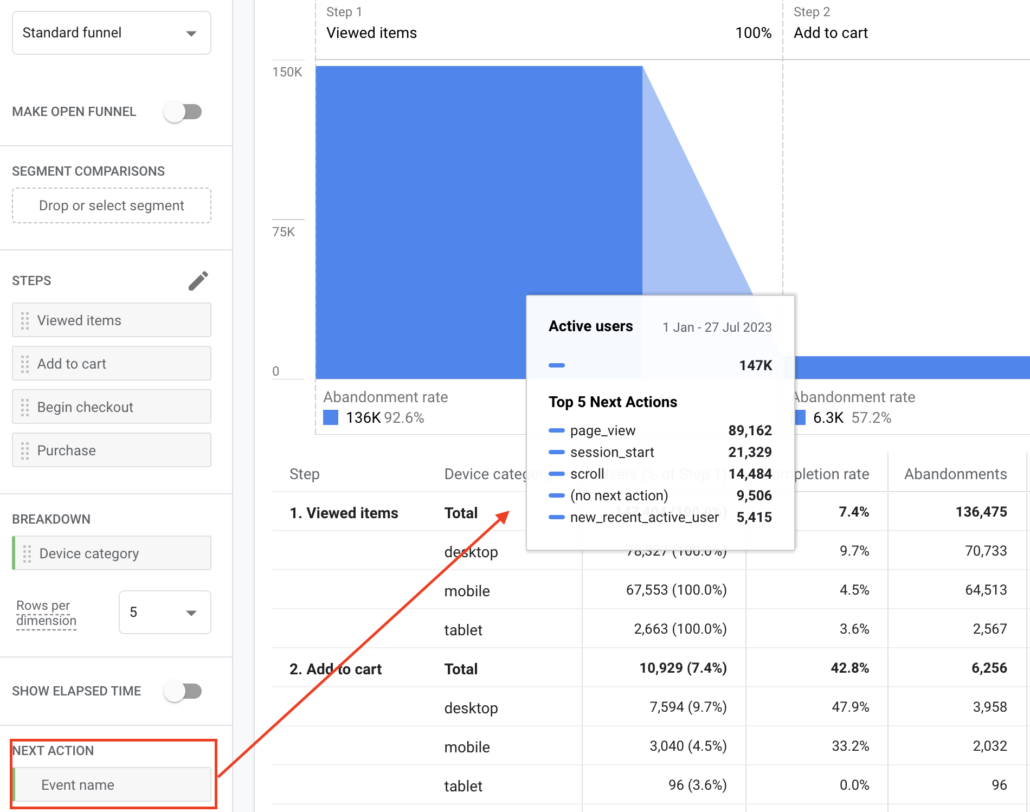
This is astonishing as this knowledge enables you to refine your strategies, improve your user experience (UX), and potentially maximise conversions or desired outcomes within your funnel.
Filters
Last but not least we see the Filter section at the bottom of the Tab settings. Filters in GA4 funnel explorations are used to narrow down the data in the funnel report based on the conditions you specify. When applying filters with multiple conditions – GA4 allows us to apply up to 10 filters – all the conditions must be met to activate the filter!
To add a filter, access the Filters tab at the bottom of the Tab Settings section. Then, click on the Add filter button and choose the desired filter type you wish to create.
GA4 offers two types of filters:
- Dimension filter: This type allows you to filter data based on specific dimensions, such as the user’s country or the device they used to access your website.
- Metric filter: This filter lets you narrow down data based on metrics, such as the number of page views or the time spent on your site.
Note: In order to use a dimension or metric in the filter, first, you have to add it to the respected Variables section.
Let’s say you want to create a filter that gives us the data only for users who are from the United States and have visited your website on a mobile device.
- First, click on the Filters box and select the country.
- Then specify the conditions: in our case, this is ‘Country exactly matches United States’. Click ‘Apply’.
- In the second filter, the condition should be: ‘Device category exactly matches mobile’. Now, your funnel data will only show people who visited your website from the United States on a mobile device.
Utilising filters gives you the power to delve deeper into your data and gain valuable insights into your users’ behaviour. By pinpointing specific areas for improvement in your funnel, you can enhance the user experience and boost conversions.
Tips for getting the most out of your funnel reports in GA4
As I mentioned at the beginning of this article I’d like to give you a few tips for getting the most out of your Explorations funnel reports:
- Use multiple funnels. You can create multiple funnels to track different conversion paths. This will give you a better understanding of how users are interacting with your website or app. Also if you finding repeated patterns will give you an idea of how to optimise your marketing efforts across various channels.
- Compare funnels. You can compare different funnels to see how they’re performing. This will help you identify which funnels are most effective.
- Use filters. You can use filters to segment your funnel reports. This will allow you to see how different user groups are interacting with your website or app.
Funnel Visualisation in Google Looker Studio
Before wrapping up this article, let’s quickly discuss building Funnel Exploration reports in Google Looker Studio, which can be very beneficial when creating e-commerce dashboards.
Building a Funnel in Google Looker Studio
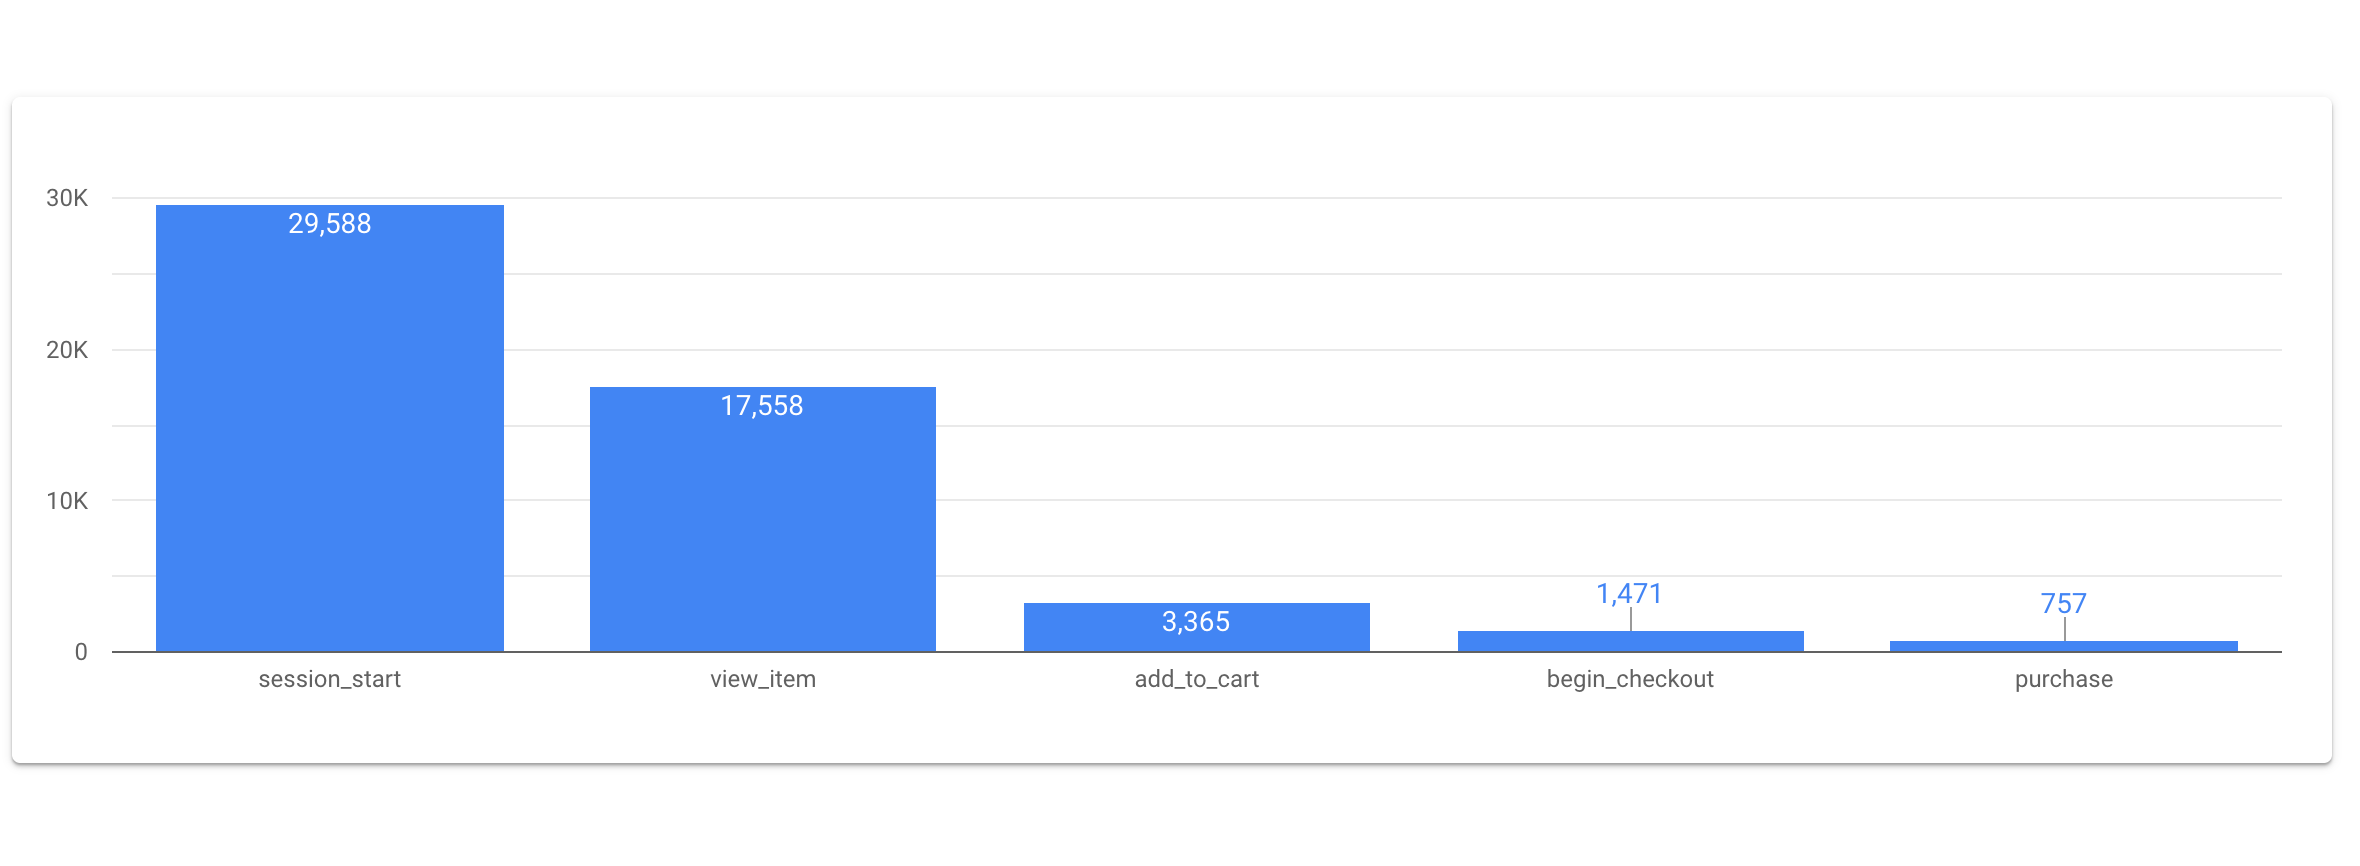
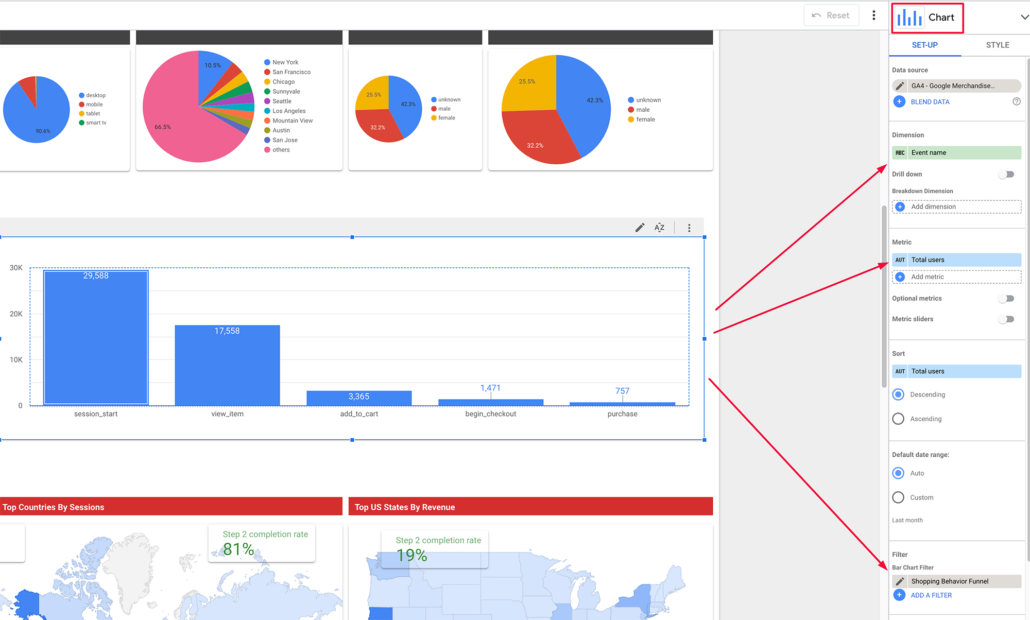
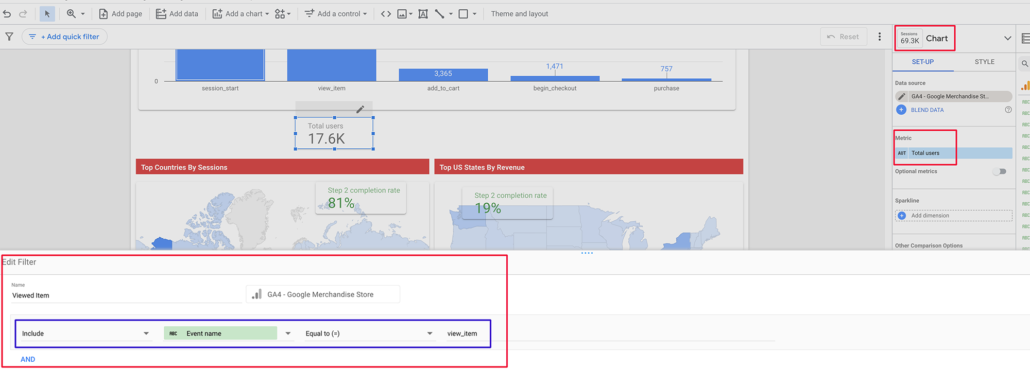
Building a Funnel in Looker Studio is surprisingly easy. Start by adding ‘Total users’ as a metric and ‘Event name’ as a dimension to a Column chart. Add a filter that includes the following regex for ‘Event name’:
session_start|view_item|add_to_cart|begin_checkout|purchase 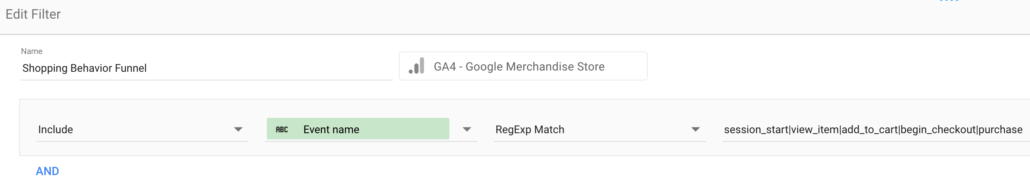
The next step is to sort ‘Total users’ by ‘Descending’, and you are pretty much done.
Funnel completion and abandonment rates
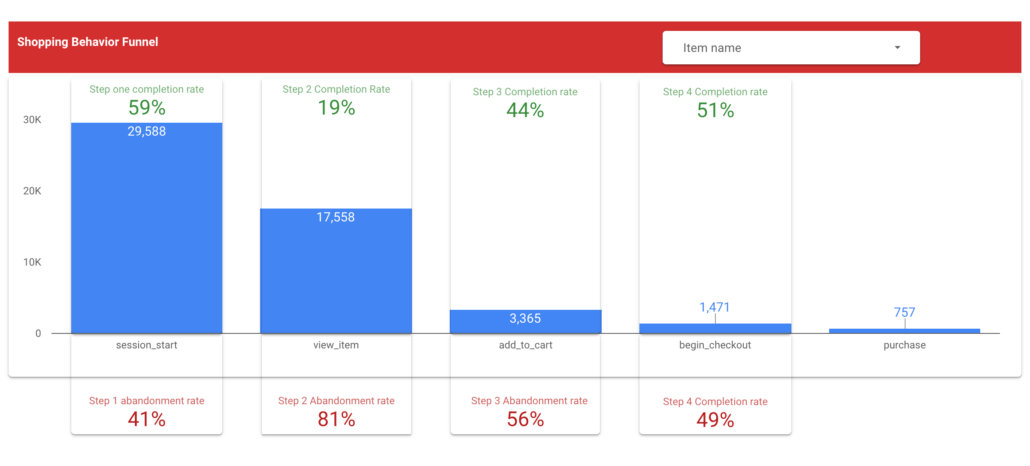
To make this funnel report look more like the funnel report in GA4 Explorations, I would normally add the completion and abandonment rates for every step of the funnel.
For example, to find the completion and abandonment rates for step 2 (view_item) in the funnel, I will first add two scorecards for steps 2 and 3 with two filters that only include events equal to view_item and add_to_cart, respectively.
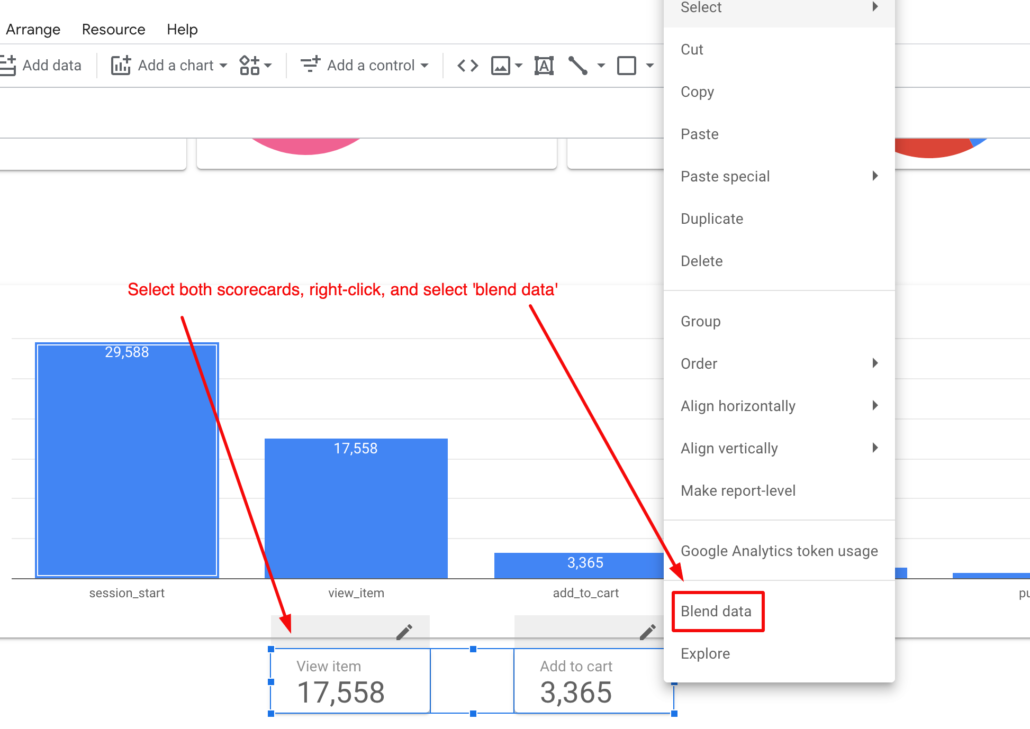
Then, I will blend the data between the two scorecards (select both scorecards, right-click, and select ‘blend data’). Notice that I renamed the two scorecards to ‘View’ and ‘Add to cart’ respectively.
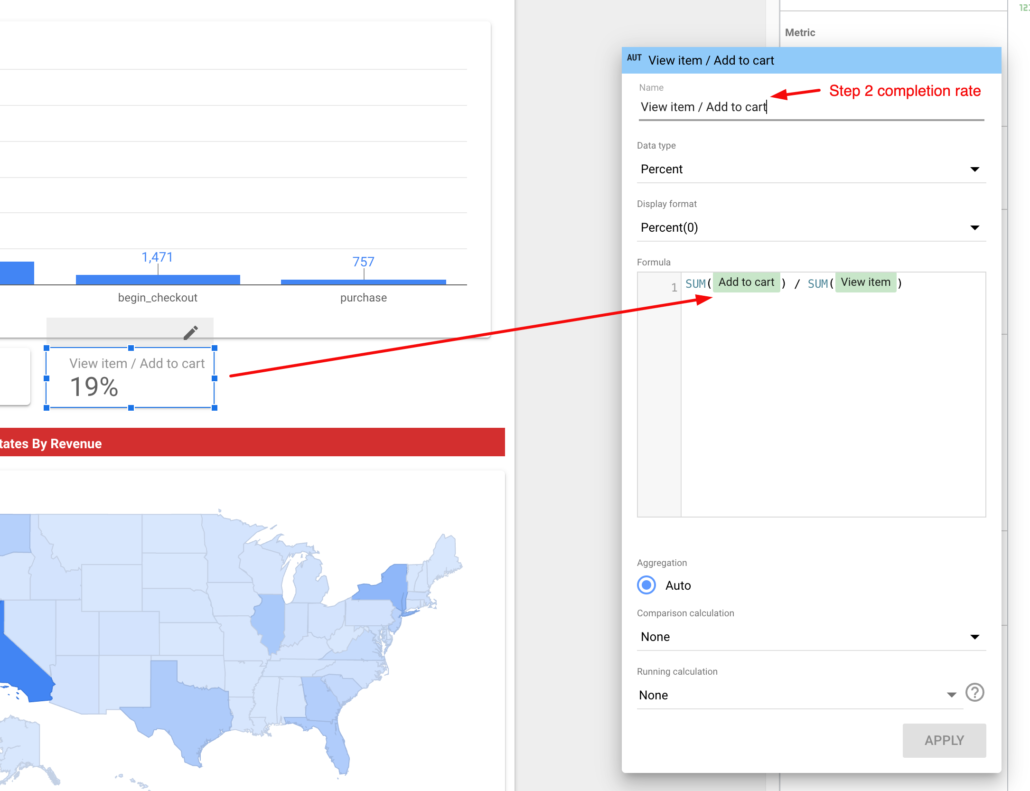
The system will generate a new custom scorecard that may give you a strange number at first, but all you have to do is go and adjust the formula to SUM(Add to cart) / SUM(View item) to get the correct number for the completion rate of step 2 (view_cart).
(To learn more about calculated metrics read Calculated fields in Google Looker Studio.)
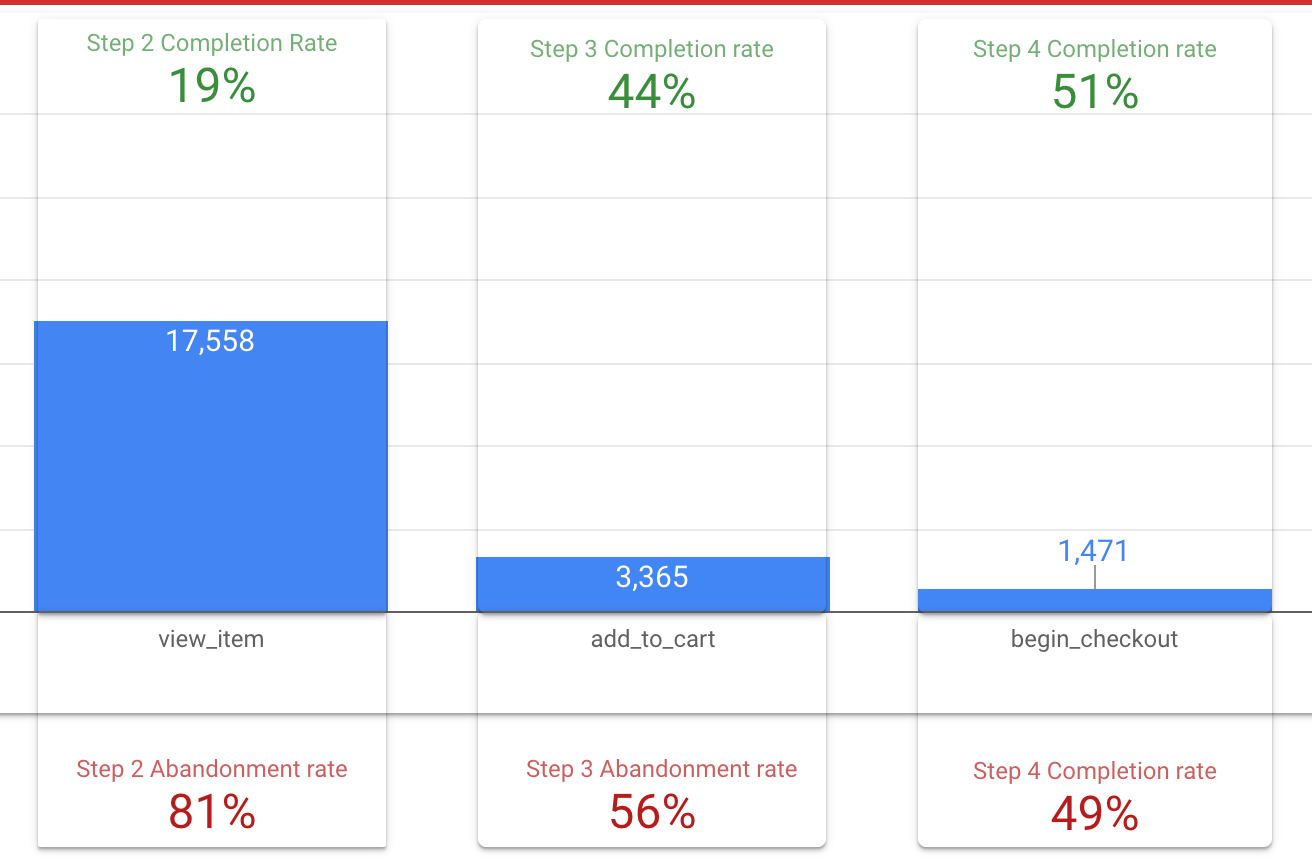
At this point, I would normally rename this scorecard from ‘View item / Add to cart’ to ‘Step 2 completion rate’.
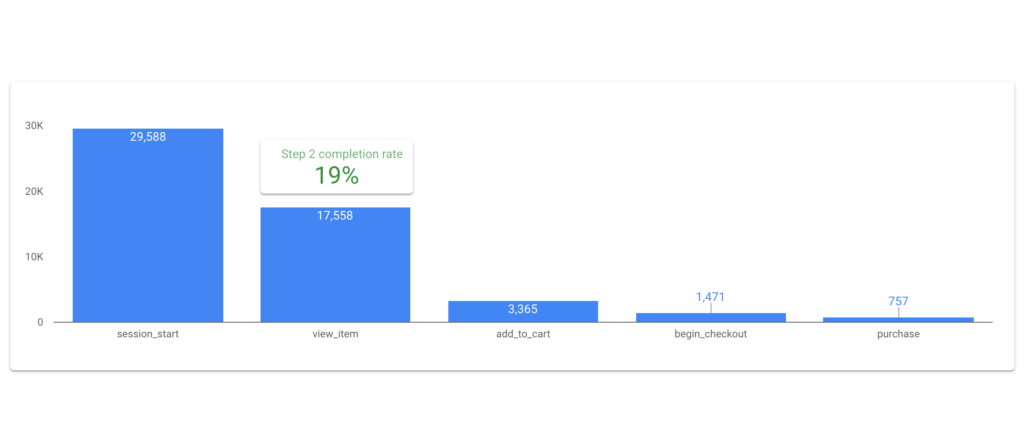
Going back to the actual number, in our example, this is 19%, indicates that 19% of people who viewed an item added it to the shopping cart.
Now, to define the abandonment rate, all you have to do is copy and paste the ‘Step 2 completion rate’ scorecard, change the formula to 1 – (SUM(Add to cart) / SUM(View item)), and give it a different name like ‘Step 2 Abandonment rate’.
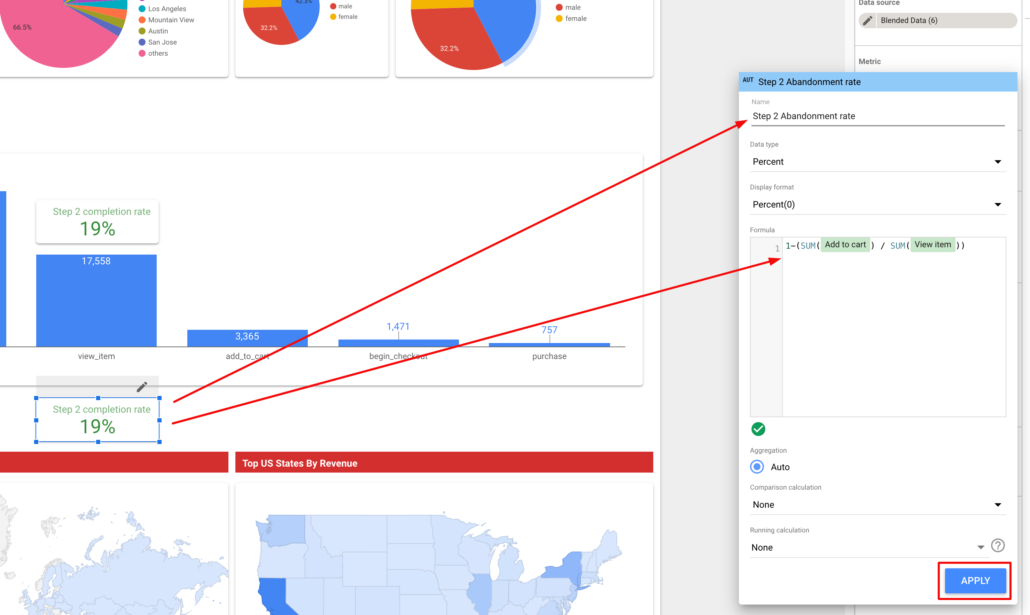
Now repeat these steps for every step of the funnel (click on the image below to see it in action).
Wrapping up
In conclusion, Google Analytics 4’s funnel reports present a potent resource to comprehend user behaviour and . By analysing how users progress through the funnel, we can elevate the overall user experience and drive more successful outcomes for our business.
With this article, I trust you now have a comprehensive grasp of funnel exploration in Google Analytics 4 but as usual, if you have any questions or queries let me know in the comments below.