
What are calculated metrics?
In Google Analytics 4 (GA4), calculated metrics are formed by blending one or more existing metrics using a mathematical formula, yielding a fresh and potentially more insightful metric.
Think of calculated metrics as the alchemists of Google Analytics 4. They transmute existing metrics and custom metrics into brand-new ones, tailored to your unique business goals.
Why use calculated metrics?
Beyond scratching analytical itches, calculated metrics offer a slew of benefits:
- Customisation: They answer questions standard metrics simply can’t. Craving an ‘engaged user’ metric that factors in time spent and specific events? Create it!
- Deeper analysis: Drill down into granular details. Gauge user engagement during key milestones in your buyer journey.
- Enhanced reporting: Build robust, custom reports with metrics that speak directly to your KPIs and business goals. Thank me later.
- Efficiencies galore: Say goodbye to manual calculations and spreadsheets. Calculated metrics automate your analysis, saving you time and effort.
How to set up calculated metrics in Google Analytics 4
Now, let’s get hands-on! Creating calculated metrics in GA4 is surprisingly straightforward. Here’s your step-by-step guide:
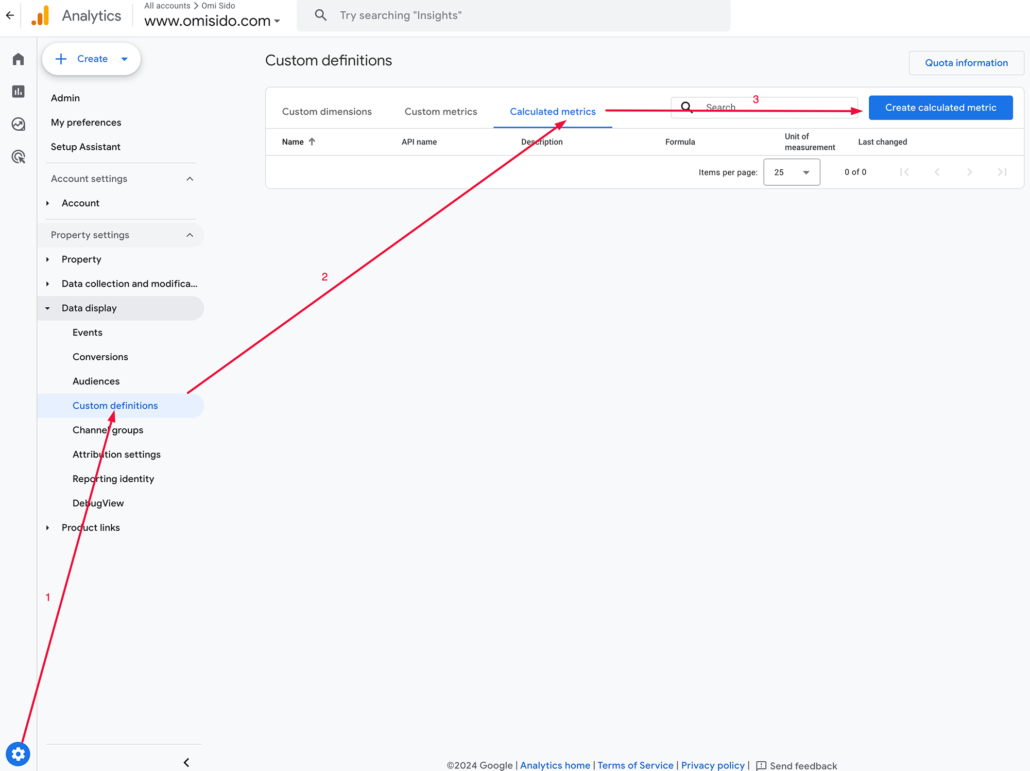
- Navigate to Admin > Custom definitions > Calculated metrics.
- Click the blue button ‘Create calculated metric’.
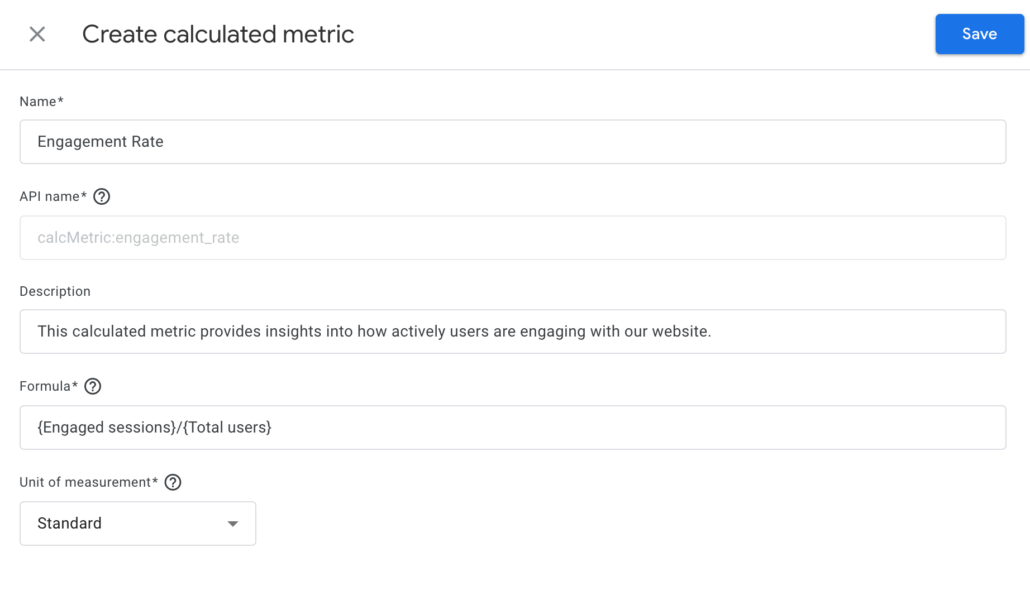
- Write a descriptive name. Providing a distinct name will facilitate quick comprehension for anyone reviewing the metric in the future.
- The API name is mandatory but it is populated automatically based on the calculated metric name. The API name must be unique and cannot be modified at a later time. Avoid using special characters, symbols, and spaces. The API name serves as the unique identifier for the calculated metric when querying through the API.
- The Description is optional, but it will make it easier for you to later recall what this metric is about.
- The Formula field is where the fun begins! Use the available metrics and operators such as (+, -, *, /) plus parentheses () to weave your analytical spell.
- Choose a unit of measurement. Keep it consistent with your chosen formula.
- Hit ‘Save’ and voila! Your new metric is ready to be unleashed.
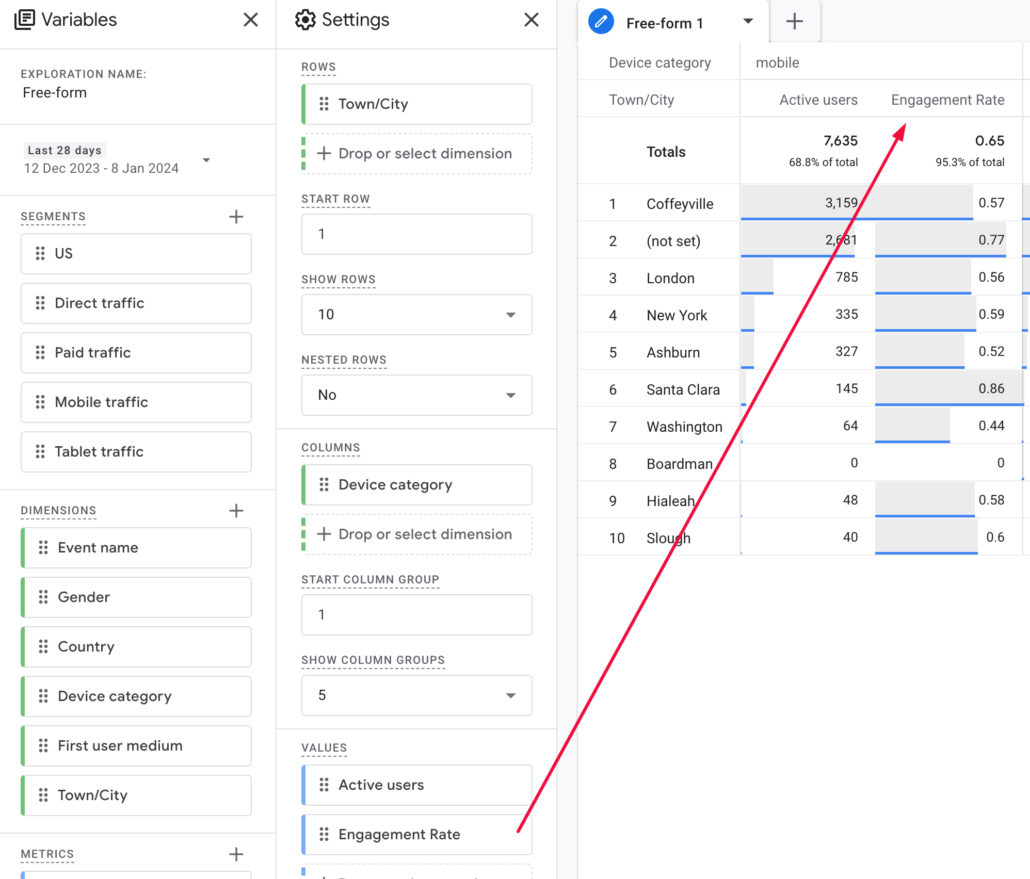
Once saved, your calculated metric will be available for use in various reports and analyses. You can use it just like any other standard metric.
Note
- In order to generate a new calculated metric, you must have Administrator or Editor access to your GA4 property.
- In standard GA4 properties, the option to create calculated metrics is limited to a maximum of five.
- It is crucial to carefully choose the metrics that will provide the most valuable insights. For users of Google Analytics 360, there is a more extensive capability, allowing the creation of up to 50 calculated metrics.
- Formulas have a character limit of 1024.
- Differentiate between custom metrics and calculated metrics. A ‘custom metric’ is employed to gather data not automatically collected by GA4. Conversely, a ‘calculated metric’ is utilised to gather/compute new data derived from the already available data in GA4.
- Last but not least, not all standard metrics are available for calculated metrics but hopefully this will change in the near future.
Examples of calculated metrics in GA 4
Feeling stuck? Here are some examples of calculated metrics:
- ({Total revenue}*1.27)/{Total users} – Here 1.27 is the conversion factor used to convert the total revenue from British pounds to US dollars. This formula can be useful for businesses that operate in multiple currencies to analyse the average revenue per user (ARPU), considering the currency exchange rate.
- {Engaged sessions}/{Total users} – This calculated metric provides insights into how actively users are engaging with your website or app on average. A higher engagement rate suggests that users, on average, are more actively interacting with your content during their sessions. This can be valuable for assessing the overall user experience, content effectiveness, and the success of engagement strategies on your website.
- {Gross purchase revenue}/{Transactions} – This metric helps you understand the average value of each transaction (Average Transaction Value) on your site. It’s a key indicator for e-commerce businesses to assess the overall performance of their sales and revenue generation. A higher average revenue per transaction is generally positive, indicating that each transaction is contributing more to the total revenue. It can be useful for evaluating pricing strategies, product performance, and overall revenue growth.
- {Views}/{Transactions} – This metric can be valuable for assessing the effectiveness of your content or pages in converting visitors into customers. A higher conversion rate suggests that a higher percentage of visitors are taking the desired action (making a purchase) after viewing the content, while a lower conversion rate may indicate areas for improvement in your content or conversion funnel.
- {Total users}-{Active users} – This metric can be useful for understanding the size of your audience that is not currently interacting with your site. It might be valuable for assessing user retention, re-engagement strategies, or identifying potential areas for improvement in user engagement.
- {Gross purchase revenue}/{Transactions} – Average Order Value (AOV) helps you understand the average value of each transaction on your site, which can be useful for assessing the overall performance of your e-commerce activities and making informed business decisions.
- {Item discount amount}/{Item revenue} – This metric helps you understand what percentage of the total revenue for those specific items is attributed to discounts. It can be useful for analysing the effectiveness of discount strategies, evaluating the impact of discounts on sales, and making informed decisions regarding pricing and promotional activities.
- ({Ads cost}/{Total revenue})*100 – By dividing the Ads Cost by the Total Revenue and multiplying by 100, you get the Advertising Cost Ratio (Advertising-To-Sales Ratio). This ratio is used to assess the efficiency of your advertising efforts by measuring how much of your total revenue is spent on advertising. A lower ACR indicates a more efficient use of advertising resources, while a higher ratio may suggest that a significant portion of revenue is being used to cover advertising costs.
Remember
- You can combine standard and custom metrics in your formulas.
- Use parentheses for complex calculations.
- Test your formulas before unleashing them on your reports.
- Don’t be afraid to experiment and refine your metrics!
Calculated metrics beyond GA4
Calculated metrics aren’t just for GA4. You can also create Calculated fields in Google Data Studio to enhance your dashboards and reports.
Embrace the power of calculated metrics
Calculated metrics are your gateway to a deeper understanding of your audience and business. By wielding this Google Analytics 4 superpower, you can optimise your marketing efforts, identify new opportunities, and ultimately achieve your business digital goals. So, dive into the world of calculated metrics, unleash your inner data alchemist, and discover the untapped potential hidden within your data.
Remember, the only limit is your imagination. Happy analysing!